Determination of metformin in mouse, rat, dog and human plasma samples by laser diode thermal desorption/atmospheric pressure chemical ionization tandem mass spectrometry


ARTICLE IN PRESS
Journal of Pharmaceutical and Biomedical Analysis xxx (2010) xxx–xxx
Contents lists available at
Journal of Pharmaceutical and Biomedical Analysis
Short communication
Determination of metformin in mouse, rat, dog and human plasma samples bylaser diode thermal desorption/atmospheric pressure chemical ionizationtandem mass spectrometry
John G. Swales , Richard Gallagher, Raimund M. Peter
Astrazeneca R&D, DxDMPK CVGI RA, Alderley Park, Macclesfield, Cheshire, SK10 4TG, UK
A simple, rapid and robust high-throughput assay for the quantitative analysis of metformin in plasma
Received 27 January 2010
from different species using laser diode thermal desorption interfaced with atmospheric chemical
Received in revised form 23 April 2010
pressure ionization tandem mass spectrometry (LDTD-APCI-MSMS) was developed for use in a pharma-
Accepted 26 April 2010
ceutical discovery environment. In order to minimize sample preparation a generic protein precipitation
Available online xxx
method was used to extract metformin from the plasma. Laser diode thermal desorption is a relativelynew sample introduction method, the optimization of the instrumental parameters are presented. The
method was successfully applied to spiked mouse, rat, dog and human plasma samples and was subse-
quently used to determine the oral pharmacokinetics of metformin after dosing to male rats in order to
support drug discovery projects. The deviations for intra-assay accuracy and precision across the four
species were less than 30% at all calibration and quality control levels.
2010 Elsevier B.V. All rights reserved.
tally different ionization mechanism. The analytical methods oftenrequire large sample volumes (100 L+) and the fundamental use
Metformin is a biguanide type insulin sensitizing drug used to
of chromatography means they are time consuming (each injec-
treat type-2 diabetes (Diabetes mellitus) t is used in drug dis-
tion taking multiple minutes) and often lack sensitivity (>10 ng/mL)
covery in vivo models to assess the anti-diabetic potential of other
depending on the detection method employed. Liu and Coleman
drugs, commonly as a comparison compound in oral glucose tol-
recently published a ESI-MS based method using hydrophilic inter-
erance tests (OGTT) or other pharmacokinetic/pharmacodynamic
action liquid chromatography (HILIC) adequately assayed
studies easurement of systemic concentrations of metformin
metformin with a lower limit of quantification of 0.5 ng/mL from
is thus of interest both pre-clinically across various species, and
50 L of human plasma, the use of the HILIC chromatography sys-
clinically in therapeutic drug monitoring of diabetic patients to
tem leads to cycle times of 2 min per injection.
prevent toxicity and ensure adherence to prescribed medications
Laser diode thermal desorption (LDTD) is a relatively new sam-
ple introduction source that does not require an HPLC step prior
Metformin is a highly polar molecule that is traditionally dif-
to detection via tandem mass spectrometry. LDTD has potentially
ficult to measure. Several chromatographic methods have been
many applications, however, at the time of writing this paper only
reported for metformin analysis including normal phase chro-
a limited number have been reported desorption
matography on silica and cyano columns ion exchange
of the analyte is initiated by use of an infrared laser. This generates
chromatography ion pair chromatography reversed-
neutral molecules in the gas phase from samples that have been
phase chromatography The eluent of these separation
adsorbed onto a metallic surface, in the case of LDTD this is a spe-
techniques can be directed to a tandem mass spectrometer by
cially designed stainless steel 96 or 384 well plate. When combined
use of ion sources such as electrospray ionization (ESI)
with atmospheric pressure chemical ionization (APCI) these neu-
atmospheric pressure chemical ionization (APCI) is not
tral gas phase molecules can be ionized for subsequent detection
considered the ideal ion source for metformin quantification due to
by MS/MS direct nature of LDTD means analysis times can
the risk of ion suppression from endogenous material in the sample
be greatly reduced (typically <30 s per desorption), data can be cap-
matrix, this effect is not as prevalent in APCI due to the fundamen-
tured by conventional LC–MS/MS software because laser power canbe applied in a gradient that gives rise to a MS response reminis-cent of a chromatographic peak This paper demonstrates
∗ Corresponding author.
a sensitive and robust high-throughput LDTD-APCI-MSMS method
E-mail address: (J.G. Swales).
for the determination of metformin in preclinical mouse, rat and
0731-7085/$ – see front matter 2010 Elsevier B.V. All rights reserved.
Please cite this article in press as: J.G. Swales, et al., Determination of metformin in mouse, rat, dog and human plasma samples bylaser diode thermal desorption/atmospheric pressure chemical ionization tandem mass spectrometry, J. Pharm. Biomed. Anal. (2010),
ARTICLE IN PRESS
J.G. Swales et al. / Journal of Pharmaceutical and Biomedical Analysis xxx (2010) xxx–xxx
2.2. Control plasma
Control mouse, rat and dog plasma was obtained from
the AstraZeneca breeding colonies. Control human plasma wasobtained from the AstraZeneca clinical trial unit based at AlderleyPark, Macclesfield, Cheshire, UK.
2.3. Instrumental
The LDTD source was manufactured by Phytronix Technologies
(Quebec, QC, Canada). Dried samples are loaded into the LDTD sys-tem on a specially designed LazWellTM 96-well plate manufacturedby Phytronix Technologies (Quebec, QC, Canada). The LDTD sourcehad the following settings: corona discharge needle voltage 3000 V,vaporizer temperature ambient, ion sweep gas pressure 0.3, auxil-iary gas off, sheath gas off. The carrier gas was nitrogen at a flowrate of 3 L/min. Laser power was ramped from 0% to 35% over 3 sand held at 35% power for 3 s before shutting off.
The LDTD source was mounted on a Quantum Ultra mass spec-
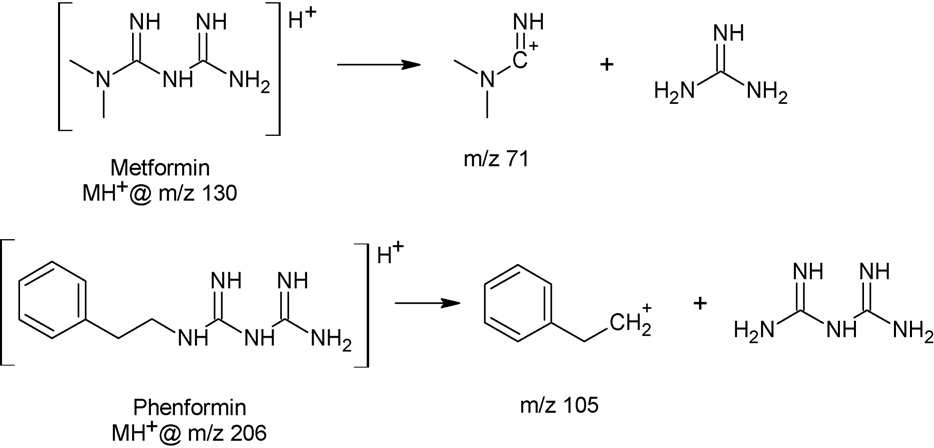
trometer (Thermo Fisher Scientific, San Jose, California, USA). Themass spectrometer was operated in positive ion selected reactionmonitoring (SRM) mode. Metformin was monitored at a parentmass of 130.097 and a daughter mass of 71.14 with a tube lensvoltage of 54.56 V and a collision energy of 22 V. Phenformin, theinternal standard, was monitored at a parent mass of 206.167 anda daughter mass of 105.08, the tube lens and collision energy were58.07 and 105.08 V, respectively. Parent molecules and fragmentsare displayed in capillary temperature was set at 270 ◦C,collision pressure at 1.5 mTorr.
The mass spectrometer software used for data capture was Xcal-
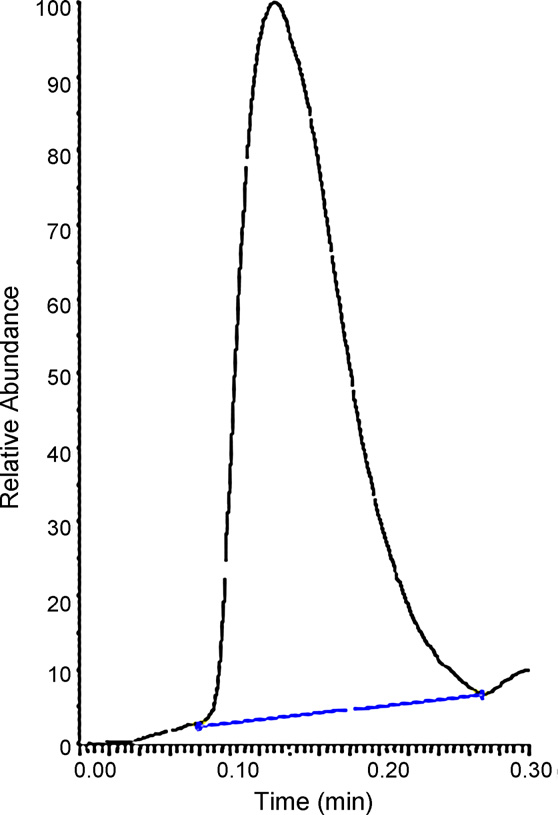
Fig. 1. Raw data showing the typical ‘chromatogram' like response for the met-
ibur 2.0.7 and QuickQuan 2.3 (Thermo Fisher Scientific, San Jose,
formin m/z 130 > 71 transition produced by LDTD-APCI-MSMS.
California, USA).
2.4. Method development
dog plasma samples and its subsequent application to rat phar-macokinetic samples in support of drug discovery. The paper also
Compound optimization was performed using the auto-tune
explores the potential of the technique for use in the analysis of
function in the Xcalibur software. Four separate aliquots of a
human plasma samples.
methanolic standard of each compound (10 g/mL) were spotted(2 L) onto a LazWellTM plate and evaporated to dryness under agentle stream of nitrogen. Each sample was then systematically
adsorbed by LDTD into the mass spectrometer, the auto-tune algo-rhythm captured the relevant instrument parameters (tube lens
2.1. Chemicals, reagents and materials
voltage, adjusted parent mass, collision energy and daughter ion)throughout the optimization process.
Metformin hydrochloride was synthesized at AstraZeneca.
Phenformin hydrochloride, the internal standard, was obtained
2.5. Solutions and standards
from Sigma–Aldrich (Poole, Dorset, UK). HPLC grade methanol waspurchased from Thermo Fisher Scientific (Loughborough, Leices-
Stock solutions of metformin and phenformin were prepared
tershire, UK).
in methanol to give a final concentration of 1 mg/mL. Subsequent
Fig. 2. Structures of metformin and phenformin and the corresponding fragment ions monitored by MS/MS.
Please cite this article in press as: J.G. Swales, et al., Determination of metformin in mouse, rat, dog and human plasma samples bylaser diode thermal desorption/atmospheric pressure chemical ionization tandem mass spectrometry, J. Pharm. Biomed. Anal. (2010),doi:
ARTICLE IN PRESS
J.G. Swales et al. / Journal of Pharmaceutical and Biomedical Analysis xxx (2010) xxx–xxx
working solutions of metformin for use in calibration curve con-
accuracy of each calibration standard used to construct the cali-
struction were prepared by serial dilution of the stock solution.
bration curve was ±30% of nominal concentration, with the curve
A protein precipitation solvent was prepared using the phe-
constructed from no less than 5 points. The accuracy of at least 3/4
normin stock solution diluted to a concentration of 0.1 g/mL in
of the quality controls should was within ±30% of nominal con-
centration. The acceptance criteria values are deemed acceptable
Samples for the standard curves and quality controls were pre-
within a discovery bioanalysis environment.
pared by spiking control plasma with the appropriate metformin
Pharmacokinetic parameters were calculated using non-
working solution. The calibration standards were prepared at 5, 10,
compartmental analysis performed in WinNonlin 5.2.1 (Pharsight
50, 100, 500, 1000 and 2000 ng/mL. Quality controls were prepared
Corp., Mountain View, California, USA).
at 10, 100 and 1000 ng/mL.
2.6. Sample preparation and extraction
3. Results and discussion
To precipitate 50 L of mouse, dog and human plasma, 500 L
Metformin and the internal standard both showed a good MS
of protein precipitation solvent containing internal standard were
response when introduced into the mass spectrometer by the LDTD
added. Ion suppression in terms of a significant drop in internal
source. Various laser power settings were evaluated and ranged
standard response was observed at the top end of the calibra-
from 25% to 45% in order to achieve the best MS response possi-
tion curve using this ten-fold dilution with rat plasma, the ratio
ble for metformin. 35% laser power gave the most intense response
of the precipitation solvent was thus increased to twelve-fold
with no improvement being observed using higher laser power,
to compensate for this effect. Precipitated samples were then
suggesting that at 35% laser power all of the sample was being
mixed for 30 s prior to centrifugation at 3700 g for 20 min. The
desorbed from the LazWellTM plate.
supernatant was then directly applied to the LazWell plates (2 L
As LDTD is a direct introduction technique all of the analytes are
per sample) and evaporated to dryness under a gentle stream of
desorbed into the mass spectrometer at the same time. It was thus
necessary to be vigilant for any ion suppression effects within eachassay and this was achieved by monitoring the internal standardvariation (typical range 11–21% in these experiments) and calibra-
2.7. Data analysis and method validation
tion curve linearity within each analytical run. Ion suppression wasobserved in the analysis of rat plasma samples when the protein
All data was processed using QuickQuanTM (Gubbs Inc.,
precipitation method used a ten-fold ratio (sample:precipitation
Alpharetta, Georgia, USA) software. Linear least-squares regression
solvent) resulting in variation of the internal standard by 31%
with a 1/x weighting of the peak area ratios (analyte/IS) versus
throughout the analytical run (n = 84). This was largely due to sup-
the nominal concentration of the calibration standards was used
pression of the IS signal at the higher metformin calibration levels.
to construct the calibration curves. Eight calibration standards
A repeat experiment was performed using a 1:12 dilution with the
between 1 and 2000 ng/mL (n = 6 at each level) were prepared in
precipitation solvent and this improved internal standard variabil-
each species of plasma. Quality controls were spiked at 10, 100
ity (18%). Linearity was comparable across the different dilution
and 1000 ng/ml (n = 6 at each level) in each species of plasma and
methods, 0.9989 and 0.9985 for the ten-fold and twelve-fold dilu-
were interspersed between the calibration standards. One set of
tions respectively.
calibration standards from each species was used to construct cal-
A response was observed for metformin in extracted plasma
ibration curves and quantify the subsequent calibration samples
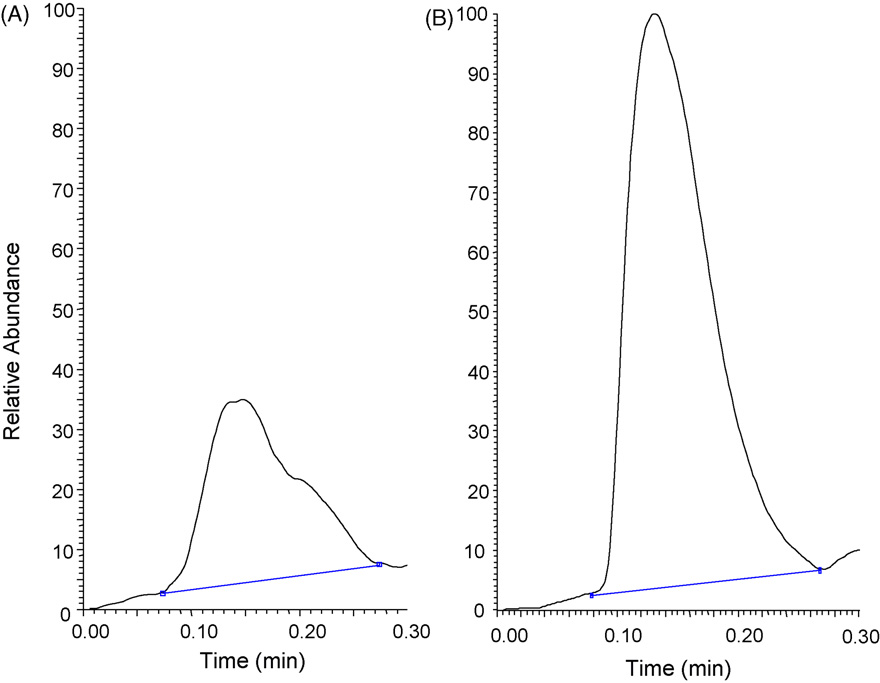
blank samples across the species. representative raw
and quality controls. All Calibration standards and quality con-
data obtained upon desorption of an extracted rat plasma blank
trols were used to calculate intra-assay accuracy and precision at
sample compared to desorption of a calibration standard in the
each level in each matrix to establish the calibration range for each
same matrix at the LLOQ. The response in the calibration standard at
the LLOQ was over 3 times that of the blank sample in terms of peakarea and over 3 times greater in terms of signal to noise ratio. The
2.8. Accuracy, precision and specificity
peak in the blank sample could be due to several factors includ-ing the inherent nature of the LDTD sample introduction process
Intra-assay accuracy was evaluated by comparing the mean
to the mass spectrometer, cross contamination during the extrac-
measured concentrations of the calibration standards and quality
tion procedure or it may be attributed to the low mass region that
controls with their nominal concentrations. Intra-assay precision
metformin falls into and endogenous background noise.
was calculated based on the coefficient of variation of each set
The intra-assay accuracy and precision throughout the analyt-
calibration standards and quality controls (n = 6). The assay was
ical runs were within acceptable limits for discovery bioanalysis.
deemed acceptable for the analysis of samples in each matrix if the
Accuracy and precision for the calibration standards (n = 6) within
intra-assay accuracy and precision deviated by ±30%.
the validation experiments was ±20%, ±30%, ±30% and ±30%
The specificity of the method was established by assaying 12
for mouse, rat, dog and human plasma, respectively
lots of blank control plasma and comparing the response of each
The lower limits of quantification (LLOQ) were equal to 5, 5, 5,
blank relative to the lowest calibration standard.
and 1 ng/mL in mouse, rat, dog and human plasma, respectively.
The intra-assay accuracy and precision of quality controls was
2.9. Method application
within ±25% across the species with the exception ofthe 10 ng/mL mouse plasma quality control which had an accu-
Two Hans Wistar rats were dosed orally with metformin at a
racy of 72.1% and met our acceptance criteria set at ±30%. The
dose level of 50 mg/kg in order to support dose setting of a planned
bottom standard in mouse, rat and dog plasma showed poor accu-
pharmacodynamic study. Plasma samples (50 l) were taken at
racy and precision and the metformin response was not considered
0.25, 0.5, 1, 2, 3, 6, 12 and 24 h post administration.
adequate in terms of signal to noise to accept the 1 ng/mL standards
For the analysis of rat pharmacokinetic samples, quality con-
as the LLOQ.
trols samples (in duplicate) were interspersed throughout the
Raw data was reprocessed in the absence of internal standard
unknowns. The analytical batch was considered acceptable if the
(data not shown). Under these conditions the accuracy of the assay
Please cite this article in press as: J.G. Swales, et al., Determination of metformin in mouse, rat, dog and human plasma samples bylaser diode thermal desorption/atmospheric pressure chemical ionization tandem mass spectrometry, J. Pharm. Biomed. Anal. (2010),
ARTICLE IN PRESS
J.G. Swales et al. / Journal of Pharmaceutical and Biomedical Analysis xxx (2010) xxx–xxx
Fig. 3. LDTD-APCI-MSMS raw data of the product ions of metformin at m/z 130 → 71 in (A) a protein precipitated rat plasma blank and (B) a calibration standard at the LLOQ.
Table 1
Summary of intra-assay accuracy and precision (%) of LDTD-APCI-MS calibration standards.
Cal range (ng/mL)
Accuracy range (%)
Precision range (%)
Table 2
Intra-assay accuracy and precision (%) of LDTD-APCI-MS for quality control samples.
remained within the acceptance criteria across the calibration and
to 5 ng/mL using the LDTD method, intra-assay precision is stated
quality control range for mouse and rat plasma but failed in dog
as being below 8.94% compared to 16.0%, 23.3% and 22.9% at the
and human plasma. Precision was greatly affected by the omis-
10, 100 and 1000 ng/mL quality control levels (n = 4) for the LDTD
sion of the internal standard, each matrix failed the acceptance
method. The data generated by LDTD have been used to assess the
criteria indicating high variability when an internal standard is notused.
A typical validation run of 84 desorptions was completed in
50 min by elimination of the chromatography step, an equivalentLC–MS/MS analysis would require around 3.5 h of mass spectrome-ter time based on our in-house chromatography system which hasa 2.5 min cycle time.
Having demonstrated that the method was accurate and pre-
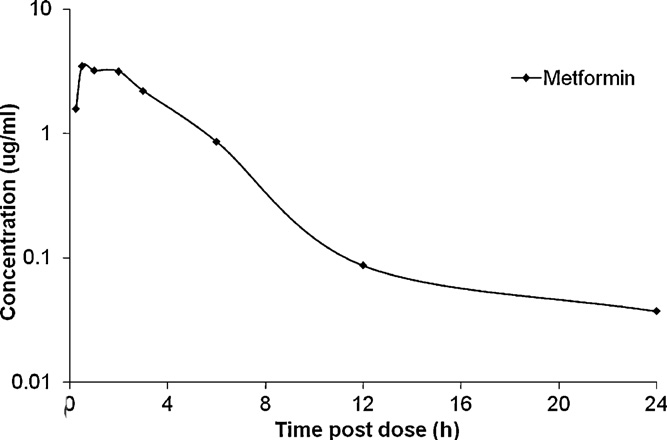
cise within the defined acceptance criteria the assay was appliedto a rat plasma pharmacokinetic study. The mean venous plasmaconcentration-time profile of metformin after oral administrationat 50 mg/kg to male Hans Wistar rats are shown in Thepharmacokinetic parameters derived from the analysis are listedin Cmax was 3.9 ± 0.651 g/mL and occurred at 1.3 h.
The oral half-life of metformin was 3.2 ± 0.1 h and the area underthe plasma concentration-time curve was 16.7 g h/mL. The resultsshown in favorably to values reported in the liter-ature a reversed-phase HPLC method and ultraviolet
Fig. 4. Mean venous plasma concentration-time profiles of metformin after oral
detection. The literature method had a LLOQ of 50 ng/mL compared
administration of the drug at 50 mg/kg to male Hans Wistar rats.
Please cite this article in press as: J.G. Swales, et al., Determination of metformin in mouse, rat, dog and human plasma samples bylaser diode thermal desorption/atmospheric pressure chemical ionization tandem mass spectrometry, J. Pharm. Biomed. Anal. (2010),doi:
ARTICLE IN PRESS
J.G. Swales et al. / Journal of Pharmaceutical and Biomedical Analysis xxx (2010) xxx–xxx
[3] UK Prospective Diabetes Study Group, Effect of intensive blood-glucose control
Pharmacokinetic parameters of metformin after oral administration of the drug at
with metformin on complications in overweight patients with type 2 diabetes,
50 mg/kg to male Hans Wistar rats.
Lancet 352 (1998) 854–865.
[4] K. Heinig, F. Bucheli, Fast liquid chromatographic–tandem mass spectrometric
50 mg/kg lit. values (n = 7)
(LC–MS–MS) determination of metformin in plasma samples, J. Pharm. Biomed.
Anal. 34 (2004) 1005–1011.
[5] N. Koseki, H. Kawashita, M. Niina, Y. Nagae, N. Masuda, Development and vali-
dation for highly selective quantitative determination of metformin in human
plasma by cation exchanging with normal-phase LC/MS/MS, J. Pharm. Biomed.
AUC0-␣ (g h/mL)
Anal. 36 (2005) 1063–1072.
[6] S. AbuRuz, J. Millership, J. McElnay, Determination of metformin in plasma
using a new ion pair solid phase extraction technique and ion pair liquid chro-
pharmacokinetic/pharmacodynamic relationship of potential drug
matography, J. Chromatogr. B 798 (2003) 203–209.
candidates in relation to metformin.
[7] M. Wang, I. Miksa, Multi-component plasma quantitation of antihyperglycemic
pharmaceutical compounds using liquid chromatography–tandem mass spec-trometry, J. Chromatogr. B 856 (2007) 318–327.
[8] M.A. Sipoli Marques, A. de Souza Soares, O. Woyames Pinto, P. Tupinamba Wer-
neck Barroso, D. Pereira Pinto, M. Ferreira, E. Werneck-Barroso, Simple andrapid method determination for metformin in human plasma using high per-
A high-throughput, sensitive and robust assay is reported for the
formance liquid chromatography tandem mass spectrometry: application to
determination of metformin in mouse, rat, dog and human plasma
pharmacokinetic studies, J. Chromatogr. B 852 (2007) 308–316.
using LDTD-APCI-MSMS. This method has significant advantages in
[9] D. Cun-Gang, Z. Zhen, G. Qing-Hua, Z. Xiao-Jin, M. Li-Li, Simultaneous
terms of simplicity and sample analysis time. The assay was vali-
determination of metformin and glipizide in human plasma by liquidchromatography–tandem mass spectrometry, Biomed. Chromatogr. 21 (2007)
dated in terms of accuracy and precision for use in a pharmaceutical
discovery environment and the analysis of real pharmacokinetic
[10] C. Georgita, F. Albu, V. David, A. Medvedovici, Simultaneous assay of metformin
study samples was demonstrated. Sample preparation time was
and glibenclamide in human plasma based on extraction-less sample prepara-tion procedure and LC/(APCI)MS, J. Chromatogr. B 854 (2007) 211–218.
minimized by the use of a generic protein precipitation extrac-
[11] Y. Wang, Y. Tang, J. Gu, J.P. Fawcett, X. Bai, Rapid and sensitive liquid
tion technique that enabled metformin to be quantified across the
chromatography–tandem mass spectrometric method for the quantitation of
species with a lower limit of quantification of 1–5 ng/mL using
metformin in human plasma, J. Chromatogr. B 808 (2004) 215–219.
[12] X. Chen, Q. Gu, F. Qiu, D. Zhong, Rapid determination of metformin in human
50 L of plasma.
plasma by liquid chromatography–tandem mass spectrometry method, J. Chro-
The rapid nature of the LDTD sample introduction technique is
matogr. B 802 (2004) 377–381.
a major step forward for bioanalysis, the speed of the technique
[13] A. Liu, S.P. Coleman, Determination of metformin in human plasma using
hydrophilic interaction liquid chromatography–tandem mass spectrometry, J.
allowing more efficient use of mass spectrometer time.
Chromatogr. B 877 (2009) 3695–3700.
The use of LDTD-APCI-MSMS in the analysis of human plasma
[14] J. Wu, C.S. Hughes, P. Picard, S. Letarte, M. Gaudreault, J.F. Levesque, D.A.
samples was demonstrated. Human plasma is not routinely anal-
Nicoll-Griffith, K.P. Bateman, High-throughput cytochrome P450 inhibitionassays using laser diode thermal desorption-atmospheric pressure chemical
ysed in a discovery environment but the results indicate that the
ionization-tandem mass spectrometry, Anal. Chem. 79 (2007) 4657–4665.
technique could potentially be applied to therapeutic drug moni-
[15] P.B. Fayad, M. Prevost, S. Sauve, Laser diode thermal desorption/atmospheric
toring in the clinic.
pressure chemical ionization tandem mass spectrometry analysis of selectedsteroid hormones in wastewater: method optimization and application, Anal.
Chem. 82 (2010) 639–645.
[16] P. Picard, P. Tremblay, E. Real Paquin, Mechanisms involved in positive atmo-
spheric pressure chemical ionization (APCI) of an LDTD source, in: Proc. of the
[1] A.J. Krentz, C.J. Bailey, Oral antidiabetic agents: current role in type 2 diabetes
57th ASMS Conf. on Mass Spectrom. and Allied Topics, TP637, May, 2009.
mellitus, Drugs 65 (2005) 385–411.
[17] Y.H. Choi, S.G. Kim, M.G. Lee, Dose-independent pharmacokinetics of met-
[2] J.B. O'Sullivan, C.M. Mahan, Criteria for the oral glucose tolerance test in preg-
formin in rats: hepatic and gastrointestinal first-pass effects, J. Pharm. Sci. 95
nancy, Diabetes 13 (1964) 278–285.
(2006) 2543–2552.
Please cite this article in press as: J.G. Swales, et al., Determination of metformin in mouse, rat, dog and human plasma samples bylaser diode thermal desorption/atmospheric pressure chemical ionization tandem mass spectrometry, J. Pharm. Biomed. Anal. (2010),
Source: http://disruptechno2.free.fr/Phytronix/Determination%20of%20metformin%20in%20mouse,%20rat,%20dog%20and%20human%20plasma%20samples%20by%20LDTD-APCI-MSMS.pdf
Weitere Files findest du auf DIE FILES DÜRFEN NUR FÜR DEN EIGENEN GEBRAUCH BENUTZT WERDEN. DAS COPYRIGHT LIEGT BEIM JEWEILIGEN AUTOR. ZUSAMMENFASSUNGEN COMER: KLINISCHE PSYCHOLOGIE. KP. 4, 7, 9, 14 4. Klinische Untersuchung, klinische Urteilsbildung und klinische Diagnose Klinische Praktiker interessieren sich vorwiegend für ideographische (personenspezifische) Information über ihre Klienten. Um ihnen helfen zu können, müssen sie diese Menschen so umfassend wie möglich verstehen und die Natur und Ursprünge ihrer Probleme erkennen. Dieses ideographische Verständnis erreichen sie durch Untersuchung, Urteilsbildung und Diagnose. 4.1. Die klinische Untersuchung Klinische Untersuchung: Die Methoden der klinischen Untersuchung sollen verschiedene Dinge feststellen ob und warum sich eine Person abweichend verhält wie man ihr helfen könnte ob eine Person Fortschritte gemacht hat ob die Behandlung geändert werden muss Klinische Untersuchungen spielen auch in der Forschung eine wichtige Rolle, die Forscher müssen wissen, ob eine best. Stichprobe repräsentativ ist, dazu müssen sie die Probanden untersuchen können. Manchmal verlassen sich die Forscher aber auch auf die Untersuchungen, welche die Kliniker bereits geleistet haben. Welche jeweiligen Untersuchungsverfahren und Hilfsmittel ein Kliniker auswählt, hängt von seiner theoretischen Orientierung ab: Persönlichkeitstest: Sie geben psychodynamisch orientierten Klinikern Infos über Teilbereiche der Persönlichkeit und decken womöglich unbewusste Konflikte eines Menschen auf. Verhaltensanalyse: Behavioristische und kognitiv orientierte Kliniker benutzen Unter-suchungsmethoden, die detailliertere Infos liefern. Die Verhaltensanalyse zielt auf eine funktionale Analyse des Verhaltens der Person ab; wie die betreffenden Verhaltensweisen gelernt haben und verstärkt wurden. Alle theoretischen Ansätze haben Hunderte von Untersuchungsverfahren und Werkzeugen entwickelt, die meisten lassen sich aber in drei Kategorien zuordnen: klinischen Interviews, Tests und Beobachtungen. Klinische Interviews Klinische Interviews: In zwischenmenschlichen Aktionen können wir Reaktionen auf unsere Fragen beobachten und ihre Antworten hören, sehen, wie die Person uns beobachtet und einen allgemeinen Eindruck von der Person erhalten. Das klinische Interview ist eine solche direkte Begegnung. Die Art wie Menschen etwas sagen kann genau so aufschlussreich sein, wie das, was sie sagen. Durchführung des Interviews Der Interviewer muss herausfinden, welcher Hintergrund und welche Erfahrungen den Klienten zu dem gemacht haben, was er ist: detaillierte Informationen über die
Hubble: Linked Data Hub for Clinical Decision Rinke Hoekstra1,3, Sara Magliacane1 Laurens Rietveld1, Gerben de Vries2, Adianto Wibisono2, and Stefan Schlobach1 1 Department of Computer Science, VU University Amsterdam, The Netherlands 2 Department of Computer Science, University of Amsterdam, The Netherlands 3 Leibniz Center for Law, University of Amsterdam, The Netherlands


