Recent developments in liquid chromatography–mass spectrometry and related techniques


Contents lists available at
Journal of Chromatography A
Recent developments in liquid chromatography–mass spectrometry and related
Michal Holˇcapek , Robert Jirásko, Miroslav Lísa
Department of Analytical Chemistry, Faculty of Chemical Technology, University of Pardubice, Studentská 573, 53210 Pardubice, Czech Republic
This review summarizes the state-of-art in liquid chromatography–mass spectrometry (LC–MS) and
Available online 31 August 2012
related techniques with the main focus on recent developments in the last decade. LC–MS records an
enormous growth in recent years due to the application potential in analytical chemistry, biochemistry,
pharmaceutical analysis, clinical analysis and many other fields, where the qualitative and quantitative
Mass spectrometry
characterization of complex organic, bioorganic and organometallic mixtures is needed. Beginners and
moderately experienced LC–MS users may be confused by the number of different LC–MS systems on the
market, therefore an actual overview of mass spectrometers designed for the LC–MS configuration and
matrix-assisted laser desorption/ionization mass spectrometry (MALDI-MS) from main manufacturers
is compiled here together with an independent assessment of their advantages and limitations. Current
trends in terms of mass analyzers, ionization techniques, fast LC–MS, LC–MALDI-MS, ion mobility spec-
trometry used in LC–MS, quantitation issues specific to MS and emerging mass spectrometric approaches
complementary to LC–MS are discussed as well.
2012 Elsevier B.V. All rights reserved.
Matrix-assisted laser desorption/ionization mass spectrometry (MALDI-MS) . . . . . . . . . . . . . . . . . . . . . . . . . . . . . . .
constant improvement of operating parameters of mass spectro-
meters, the situation is reviewed here again with two main goals:
Several reviews devoted to new trends in instrumental develop-
(1) to highlight recent innovations in LC–MS especially during the
ments in LC–MS and related techniques were published in previous
last decade, (2) to prepare a list of mass spectrometers currently
special issues of "Mass spectrometry: Innovation and application"
offered by main manufacturers for LC–MS and MALDI-MS config-
published in Journal of Chromatography A in other places
urations together with their technical specifications (
as well to numerous new LC–MS developments and the
and the comparison of their application potential. This task could
not be performed without the close cooperation with representa-
tives of individual manufacturers and their websites we
∗ Corresponding author. Tel.: +420 466 037 087; fax: +420 46 603 7068.
do our best to prepare fair and balanced scientific overview with-
E-mail address: (M. Holˇcapek).
out any advertisement of individual technical solutions presented
0021-9673/$ – see front matter
2012 Elsevier B.V. All rights reserved.
M. Holˇcapek et al. / J. Chromatogr. A 1259 (2012) 3–15
Overview of commercial mass spectrometers designed for LC–MS with their technical specifications provided by individual manufacturers.
Instrument name, manufacturer
Mass accuracy (ppm)
Acquisition speed (Hz)
(FWHM defined at m/z)
Flexar SQ 300 MS, PerkinElmer
LCMS-2020, Shimadzu
LC/MS Purification System, Gilson
MSQ plus, Thermo Scientific
SQ Detector 2, Waters
Amazon Speed ETD, Bruker Daltonics
LCQ Fleet, Thermo Scientific
LTQ Velos Pro, Thermo Scientific
LCMS-8030, Shimadzu
TQ Detector, Hitachi
Triple Quad 5500, AB SCIEX
TSQ Vantage, Thermo Scientific
XEVO TQ-S, Waters
QTRAP 5500, AB SCIEX
6230 TOF, Agilent
24,000 (m/z 1522)
AxION 2 TOF MS, PerkinElmer
100,000 (m/z 609)
micrOTOF II focus, Bruker Daltonics
XEVO G2 TOF, Waters
LCMS-IT-TOF, Shimadzu
10,000 (m/z 1000)
maXis 4G, Bruker Daltonics
60,000 (m/z 1222)
30 (MS), 10 (MS/MS)
micrOTOF-Q II, Bruker Daltonics
TripleTOF 5600, AB SCIEX
25 (MS), 100 (MS/MS)
XEVO G2 QTof, Waters
6550 QTOF, Agilent
Synapt G2-S HDMS, Waters
Exactive, Thermo Scientific
100,000 (m/z 200)
10 (at RP = 10,000)
Q Exactive, Thermo Scientific
140,000 (m/z 200)
12 (at RP = 17,500)
Orbitrap Elite, Thermo Scientific
240,000 (m/z 400)
8 (at RP = 15,000)
SolariX 15T, Bruker Daltonics
2,500,000 (m/z 400)
LTQ FT Ultra 7T, Thermo Scientific
750,000 (m/z 400)
2 (at RP = 50,000)
a If manufacturers have more instruments in particular series, then only the instrument with the best performance is listed here. Individual manufacturers take the full
responsibility for the correctness of technical specifications. Instruments in individual classes are sorted alphabetically according to the instrument name. This list contains
only main manufacturers and may not be comprehensive.
b Acquisition speed for low RP mass analyzers is typically specified by manufacturers in Da/s, but we have recalculated these values into Hz units for the mass range of
in this review. Authors take no responsibility for the correctness
incorrect terms is Mass Spectrometry Desk Reference compiled by
of technical specifications provided by manufacturers. MS terms
Sparkman some recommendations are not consistent with
and definitions used in this paper are in agreement with the IUPAC
previously mentioned glossary.
sponsored project the Standard Terms and Definitions for Mass
Spectrometry This database is now being maintained and
2. Overview of up-to-date mass spectrometers
updated by Murray to build a reference tool and a glossary of MS
terms with 780 entries as of July 12, 2012 Recommended
The market of MS and LC–MS is extremely dynamic and
MS terms related to the separation sciences have been published
individual manufacturers invest into the development of new
in the previous special MS issue in Journal of Chromatography A
technologies. This competition has a positive effect on frequent
valuable literature source on the use of correct and
launches of new products and technical solutions. For better
Common parameters of mass spectrometers used in LC–MS.
m/z range (upper limit)
Acquisition speed
a TOF, Orbitrap and ICR also include common hybrid configurations with Q or LIT as the first mass analyzer.
b Qs with hyperbolic rods provide mass accuracies better than 5 ppm.
M. Holˇcapek et al. / J. Chromatogr. A 1259 (2012) 3–15
Overview of commercial mass spectrometers designed for MALDI-MS with their technical specifications provided by individual
Instrument, manufacturer
Mass accuracy (ppm)
Laser (wavelength, frequency)
FWHM (defined at
LTQ XL, Thermo Scientific
N2 (337 nm, 60 Hz)
(depending on scan
Autoflex Speed, Bruker Daltonics
26,000 (m/z 3147)
Nd:YAG (355 nm, 1000 Hz)
Axima Confidence, Shimadzu
15,000 (m/z 3660)
N2 (337 nm, 50 Hz)
Axima Resonance, Shimadzu
N2 (337 nm, 10 Hz)
MALDI Synapt G2-S HDMS, Waters
32,000 (m/z 3495)
Nd:YLF (349 nm, 1000 Hz)
Axima Performance, Shimadzu
20,000 (m/z 3660)
N2 (337 nm, 50 Hz)
JMS-S3000 SpiralTOF, Jeol
60,000 (m/z 2093)
Nd:YLF (349 nm, 250 Hz)
TOF/TOF 5800 System, AB SCIEX
33,000 (for m/z range
Nd:YLF (345 nm, 1000 Hz)
UltrafleXtreme, Bruker Daltonics
40,000 (m/z 3147)
Nd:YAG (355 nm, 1000 Hz)
MALDI LTQ Orbitrap XL, Thermo
100,000 (m/z 400)
N2 (337 nm, 60 Hz)
SolariX 15T, Bruker Daltonics
2,500,000 (m/z 400)
Nd:YAG (355 nm, 1000 Hz)
a If manufacturers have more instruments in particular series, then only the instrument with the best performance is listed here. Individual manufacturers take the full
responsibility for the correctness of technical specifications. Instruments in individual classes are sorted alphabetically according to the instrument name. This list contains
only main manufacturers and may not be comprehensive.
overview of current LC–MS systems, we have compiled a list of
second sprayer or high-confidence ions from the sample, which
commercial mass spectrometers designed for LC–MS
is used for the correction of previously done external calibration by
for MALDI-MS (with their technical specifications, such as
locking particular m/z value example of lock-mass
resolving power, resolution, mass accuracy specified for internal
internal calibration is the use a subset of high confidence pep-
and external calibrations, mass-to-charge (m/z) range and acqui-
tide identifications from a first pass database search
sition speed. These tables will become obsolete quite rapidly, but
improvements of MA can be achieved by software tools to eliminate
we still believe that such current snapshot of MS technology as of
a lower dynamic range of time-to-digital converters in some mass
spring 2012 is useful. typical operating parameters
analyzers way of calibrant introduction is the use
for five basic types of mass analyzers used in LC–MS.
of dual sprayer in ESI-MS using a rapid modulation (switch in less
This review is primarily intended for low to moderately experi-
than 70 ms) between ESI emitters external calibration is
enced LC–MS users, therefore basic MS terms used in
the procedure, where the sample and the calibrant are not present
explained here. More detailed information can be found in several
in the ion source at the same time. If the mass spectrometer is stable
excellent textbooks devoted to MS basic parameter
enough without any mass drift, the external calibration may pro-
for the characterization of mass analyzer ability to resolve peaks
vide almost comparable results, but the time difference between
in mass spectra is a resolving power (RP), which is defined as
the sample and the calibrant introduction should be as low as
the m/z value of particular peak divided by the peak full width at
possible, e.g., the calibrant can be introduced between the LC injec-
half maximum (FWHM): RP = (m/z)/�m/z. The RP must be always
tion time and the void time or immediately after the elution of
defined for the particular m/z value (e.g., RP is 20,000 at m/z 922),
last peak in the chromatogram. The m/z ranges of individual mass
because the RP grows with increasing m/z value on condition of
analyzers in the maximum possible measure-
identical peak width. The older definition of RP (established for
ment span of mass detectors. The acquisition speed is typically
magnetic sector analyzers) based on two neighboring peaks of
expressed in technical specifications in Da/s for low-resolution and
identical heights and 10% valley is not used in the current LC–MS
in Hz for high-resolution mass analyzers. We have re-calculated
practice. The resolution is the inverse of RP expressed as �m/z for a
specifications for low-resolution analyzers from Da/s to Hz for the
given m/z value the above-mentioned example, the reso-
typical measurement range of 1000 m/z to allow the comparison
lution is calculated as �m/z = (m/z)/RP = 922/20,000 = 0.046. Better
among all instruments By the way, numerical values of
quality of mass analyzer is associated with lower values of resolu-
acquisition speed expressed in kDa/s and Hz for 1000 m/z range are
tion and higher values of RP (see Mass accuracy
(MA) is defined as the relative difference between the experimen-
tal m/z value and theoretical m/z value related to this theoretical
2.1. Mass spectrometers in LC–MS coupling
value including the sign (plus or minus) and expressed in ppm:
MA = 106 × ((m/z)exp − (m/z)
The best values of MA
The standard resolution of Q analyzer is a unit resolution, while
theor)/(m/z)theor.
are achieved with the internal calibration, i.e., the sample and
somewhat better resolution can be obtained at cost of a lower
the internal calibrant are introduced into the ion source at the
ion transmission and therefore lower sensitivity, as understood
same time. The introduction of internal calibrant during LC–MS
from the stability diagram resolution of spherical ITs and
may be impractical in some instances (e.g., interference of cal-
especially linear ion traps (LITs) is slightly higher compared to the
ibrant with the chromatographic separation or identical masses
Q analyzer, but the inverse relation between the resolution and
of calibrant and analyte). The "lock-mass" calibration is based
the sensitivity based on the three-dimensional stability diagram
on well-defined ion with known elemental composition coming
is again valid. The typical MA of low-resolution mass analyzers
from the background (known impurities occurring from previous
is below 100 ppm (calculated for �m/z error 0.1 at m/z 1000),
samples, mobile phase, air components, etc.), introduced by the
but such low MAs are not sufficient for the elemental formula


M. Holˇcapek et al. / J. Chromatogr. A 1259 (2012) 3–15
determination. Q rods with an ideal hyperbolic profiles provide
a higher resolution than for regular round Q rods with the MA
<5 ppm comparable to high-resolution mass analyzers (see QqQ
TSQ Vantage in Another advantage of QqQ with hyperbolic
rods is a narrow isolation width of precursor ions used for the
selected reaction monitoring (SRM), while the drawback is lower
acquisition speed. The m/z range is typically up to m/z 2000–3000
for Qs and m/z 4000–6000 for ITs The special Q with
significantly higher transmission for large ions (up to m/z 32,000)
can be fabricated in the transmission non-resolving mode only,
which means that such Qs can be used only for the transmission
of all ions but not for their mass resolution.
The comparison of high-resolution mass analyzers listed in
needs additional comments. The ICR has superior val-
ues of RP and MA among all analyzers followed by Orbitrap and
then TOF based analyzers. It is also important to realize the rela-
tion between the RP and the acquisition speed, because the highest
acquisition speed of Fourier transform (FT) mass analyzers ICR and
Orbitrap does not correspond to their highest RP. The best parame-
ters reported for FT analyzers require longer acquisition times due
to the fact that higher number of image currents has to be recorded.
The incorporation of FT mass analyzer into the fast LC–MS concept
is possible, but at cost of significantly reduced RP in comparison
to the best values reported for slow scan speeds in TOF
Fig. 1. Overview of installed LC–MS systems in the Czech Republic according to the
mass analyzers have the highest scanning speed among all mass
type of mass analyzer (in total 233 systems, update September 2011).
analyzers and also their m/z range is theoretically unlimited (e.g.,
measurements in hundred thousands Da in MALDI-TOF linear con-
dominant in the quantitative analysis, because SRM scan typical
figuration), but the m/z range of TOF based analyzers in LC–MS
for this type of analyzer is a golden standard for any LC/MS or
systems is limited to several tens of thousands. The linear dynamic
shotgun MS based quantitation. Hybrid Q-TOF instrument is
range (depends on the particular instrument and applica-
the most common in the structural characterization due to the
tion, but in general FT mass analyzers exhibit slightly lower linear
possibility of measurements of high-MA in both full-scan and
dynamic range.
MS/MS modes. In recent years, the shift from low-resolution
The price parameter in intended only as a rough guide
toward high-resolution systems including TOF based mass ana-
for typical configurations, but the real price strongly depends on
lyzers and ultrahigh-resolution (RP > 100,000) FT mass analyzers
the particular configuration and individual offers from the man-
(Orbitrap and ICR) occurs, because ultrahigh-RP and ultrahigh-MA
ufacturer. In general, Q analyzer is simplest and cheapest device
values open new possibilities in both qualitative and quantitative
followed by spherical and linear ITs. TOF analyzer is the cheapest
analyses, e.g., SRM or even SIM approaches based on ultrahigh-RP
high-resolution mass analyzer with some impressive characteris-
and therefore the possibility of very narrow widths for precursor
tics in terms of acquisition speed, m/z range and relatively good
ion isolation, which leads to increased selectivity and sensitivity.
RP and MA. FT mass analyzers, Orbitrap and especially ICR, are
high-end MS technologies with the best operational parameters,
but the instrumental complexity is obviously reflected in increased
investment costs. be understood as an overview
of common operating parameters but excluding extreme values
obtained at specific conditions, e.g., slow scan speed, reduced m/z
shows an overview of installed LC–MS systems in the
Czech Republic. The world statistics would be more representa-
tive, but reliable data does not exist unlike to our statistics for
this local central European market, where we monitor and annu-
ally update the situation from the first LC–MS system
installed at the University of Pardubice in 1995. The local statis-
tics could be affected by regional differences, but a
reasonable agreement with trends in the world. Some differences
between be explained – at least in part – by the
different way of the preparation of these graphs. the
world statistics based on the Web of Science search, while
is prepared from exact numbers of installed LC–MS systems in the
Czech Republic. In our opinion, certain overestimation of top-class
expensive instruments occur in because new technologies
are purchased primarily for research purposes yielding a higher
number of papers compared to low-cost and low-resolution mass
analyzers used mainly for routine analyses and quantitation in
industrial and clinical laboratories with a lower publication activity.
Prevailing LC–MS configurations (see are based
Fig. 2. Relative use of individual types of mass analyzers in LC–MS papers based on
on IT, TOF and Q mass analyzers. QqQ tandem mass analyzer is
the Web of Science search from March 1, 2012.
M. Holˇcapek et al. / J. Chromatogr. A 1259 (2012) 3–15
Some papers compared a real performance of different types of
modern tandem mass analyzers for particular applications, which
Suggested definitions of low, high and ultrahigh resolving power and mass accuracy
of mass analyzers.
provides valuable complementary information to
LC–MS with QqQ and IT have been compared for the determi-
Resolving power (RP, FWHM)
Mass accuracy (MA, ppm)
nation of 6 pesticides in fruits QqQ provides better linear
dynamic range, higher precision, less matrix interferences and bet-
ter robustness, while IT provides an excellent sensitivity for product
ion measurements. Four LC–MS systems equipped with Q, QqQ,
IT and Q-TOF have been compared the quantitative anal-
ysis (sensitivity, precision and accuracy) of carbosulfan and its
(Orbitrap and ICR). MALDI-QqQ-MS configuration is designed for
main transformation products. QqQ provides at least 20-fold higher
the sensitive quantitation similarly as for LC-QqQ-MS.
sensitivity compared to other mass analyzers and better linear
The instrument characteristics with their advantages and
dynamic range. The repeatability (within-day) is slightly better for
limitations are more or less identical as for the LC–MS coupling. The
Q (5–10%) and QqQ (5–9%) compared to IT (12–16%) and Q-TOF
m/z range of MALDI-TOF analyzers in hundred thousands is valid
(9–16%). Although the QqQ is more sensitive and precise, mean
only for the linear mode, while it is limited to ca. 100,000 or less
values obtained by all instruments are comparable. QqQ, TOF and
for the reflectron mode. Another issue is the sensitivity, which can
Q-TOF were compared for the qualitative and quantitative analy-
dramatically decrease for very large m/z values in the range of hun-
ses of 10 anabolic steroids in human urine allowed the
dred kDa. Measurements of large proteins in the MDa range have
detection of all analytes at the minimum required performance
been reported in the linear mode interesting configu-
limit established by the World Anti-Doping Agency (between 2 and
ration of TOF analyzer has been reported recently by Jeol, where the
10 ng/mL in urine). TOF and Q-TOF approaches were not sensitive
traveling path of ions is increased approximately up to 17 meters
enough to detect some analytes. Most compounds were detected
due to the multiple reflections the declared RP = 60,000.
by all techniques, however QqQ was necessary for the detection of
MALDI sources can be equipped with 2 basic types of lasers in
some metabolites in a few samples. TOF-based analyzers showed a
UV/vis region (gas-phase laser (nitrogen laser is used
benefit to detect non-target steroids and their metabolites in some
in all commercial applications) or solid-state lasers (neodymium-
samples. Human liver microsomal incubations with amitriptyline
doped yttrium aluminum garnet, Nd:YAG, and neodymium-doped
and verapamil were used as test samples, and early-phase "one
yttrium lithium fluoride, Nd:YLF). Nitrogen lasers are used as a
lab visit only" approaches were used with different instruments
golden standard in MALDI-MS especially due to the lower price
was the only approach detecting all metabolites, shown
and good performance with a wide range of matrices, but they
to be the most suitable instrument for elucidating as comprehen-
have certain limitations, such as the maximum repetition rate only
sive metabolite profile as possible leading also to lowest overall
up to 60 Hz and the average life span about 107 shots. The advan-
time consumption together with the LIT-Orbitrap approach. The
tage of solid-state lasers is the higher repetition rate (>1000 Hz,
latter however suffered from lower detection sensitivity and false
see and longer life time (109 shots). The combination of
negatives, and due to slow data acquisition rate required slower
advantages of nitrogen and solid-state lasers is a Nd:YAG laser
chromatography. Approaches with QqQ and Q-LIT provided the
with a modulated beam profile the superior performance
highest amount of fragment ion data for the structural elucidation,
in MALDI imaging and LC-MALDI-MS coupling. Infrared lasers in
but they were unable to provide high-MA data, suffered from many
MALDI were proposed as a valuable alternative to UV/vis lasers due
false negatives, and especially with QqQ, from very high overall
to increased life time and absorbance of virtually all (bio)organic
time consumption.
compounds in the infrared region infrared lasers are still
The 2002/657/EC European Commission Decision established
not yet available in commercial MALDI setups.
the need to obtain at least three identification points in order to con-
firm organic contaminants in animal products, which was applied
3. Current trends in LC–MS
for pesticide analyses in environmental matrices using LC–MS with
QqQ, TOF and Q-TOF QqQ instrument allowed the confir-
Basic characteristics of the quality of mass analyzer are RP
mation of detected pesticides even at very low concentrations
and MA. At present time, definitions of high-RP and also high-
(ng/L) achieving between four and five identification points when
MA are not sufficient to differentiate between high-resolution and
adding confirmatory transitions. The direct confirmation with a
ultrahigh-resolution mass analyzers, therefore we suggest updated
TOF instrument was only feasible for those compounds showing
definitions for low, high and ultrahigh RP and MA We sug-
sufficient sensitivity, isotopic pattern, or easy in-source fragmen-
gest to distinguish three basic categories of RP: low-RP (<10,000),
tation. Q-TOF provided up to 20 identification points in a single
high-RP (10,000–100,000), and ultrahigh-RP (>100,000). In fact, it
run at relatively high concentrations (sub-mg/L). Moreover, TOF-
means that most Q and IT mass analyzers belong to the low-RP
based mass analyzers allow to finding additional non-target organic
category, TOF based analyzers to the high-RP, and the ultrahigh-
RP contains two FT mass analyzers—Orbitrap and ICR. The Orbitrap
has started to approach closer to parameters typical for ICR mass
analyzers after the launch of new type of Orbitrap with 240,000 RP
2.2. Matrix-assisted laser desorption/ionization mass
recently Nikolaev et al. published a new ICR cell design
spectrometry (MALDI-MS)
they demonstrated 24 millions RP at m/z 609 recorded
over 3 min for only 7 T magnetic field. This new development in the
The widely accepted standard in the MALDI technology is the
ICR cell technology will again widen the gap between the ICR and
coupling with TOF or TOF/TOF mass analyzers, because both devices
Orbitrap. It should be kept in mind that such values of RP cannot
are working in a pulse regime and such connection is straightfor-
be achieved in the LC–MS time scale.
ward. TOF mass analyzer can be preceded by Q or IT analyzer, where
The conventional definition of high-MA is 5 ppm and better.
the limitation of such configurations is the ion transmission and
Technical specifications of most recently launched high-RP mass
the scanning speed of first Q/IT analyzer. Other alternatives are the
analyzers report MA 3 ppm and better even for the external cal-
coupling of MALDI source with different types of mass analyzers
ibration, for FT mass spectrometers with the internal calibration
than TOF, either low-resolution (LIT and QqQ) or high-resolution
or the lock-mass approach below 1 ppm (ultrahigh-MA). The best
M. Holˇcapek et al. / J. Chromatogr. A 1259 (2012) 3–15
specification for 15 T ICR instrument is reported better than
niques can be coupled to MS as well, as illustrated in recent works
0.25 ppm for the internal calibration FT-ICR mass ana-
on thin-layer chromatography (TLC) coupled to MALDI-MS
lyzers are rather expensive, so their application is typical in
or other atmospheric pressure surface sampling/ionization tech-
the most demanding analytical tasks, such as proteomics
niques as well is simple and cheap technique still used for
petroleomics metabolomics The reasonable
the routine analysis, for example in lipidomics
definition of potential ranges for individual expected elements and
the inclusion of isotopic ratios in the searching algorithm may
3.1. Fast LC–MS
further improve the reliability of elemental composition deter-
mination In fact, the level of MA required for the reliable
The group of fast LC–MS techniques comprises various
elemental composition determination strongly depends on the
approaches with the common goal to achieve the highest sam-
actual m/z value, because the number of possible combinations of
ple throughput and the good separation efficiency. The most
given elements exponentially grows with the m/z value
widespread and well established approach is UHPLC
small m/z values (ca. below m/z 200), the MA <5 ppm is satisfactory,
is based on the use of small particle size (sub-two m particles)
but such MA bring too many possible combination in the m/z range
at ultrahigh-pressures (up to 1300 bars) yielding fast analyses and
of 500–1000. For biomolecules with MW > 1000 Da, MA better than
narrow chromatographic peaks. On the other hand, it requires
1 ppm may not be sufficient for the unequivocal determination of
higher acquisition speed of mass spectrometer to obtain enough
elemental formula.
sampling points for the reliable peak integration. Typical peak
The miniaturization is an important issue considered in all
widths in routine UHPLC–MS bioanalyses are 3–10 s
fields of analytical instrumentation including both parts of LC–MS
peak widths in the fast/ultrafast LC–MS are generally in the range
coupling. The trend in LC is a reduction of the column diameter
1–3 s, but they can be narrower than 1 s under well optimized con-
from standard bore (3–4.6 mm ID) or narrow bore (1–3 mm ID) to
ditions For good reproducibility and precision in LC–MS
capillary columns (<1 mm ID) or even separations on chips
quantitation, at least 12–15 points per chromatographic peak are
Two commercial solutions for chip-based separations are offered
recommended, but the current practice often rely on the lower
by Agilent Technologies and Waters The reading of
number of data points per peak (8–10) in the qualitative and semi-
specialized reviews is recommended for more details
quantitative analysis, but it may compromise the peak shape. The
terms of LC–MS, capillary columns and chips work with flow rates
minimum acquisition speed to acquire 10 sampling points per peak
in the range of nL/min, which is ideally suited for the coupling with
is 3–10 Hz for the average peak width 1–3 s and 10–20 Hz for the
nanoelectrospray ionization
average peak width 0.5–1 s, but of course higher scanning speeds
The two-dimensional (2D) LC either in off-line on-line
are useful to generate more sampling points per peak for a better
mode the separation of highly complex mixtures,
quantitation. Such acquisition speeds are achieved by modern TOF
such as in proteomics the analysis of nat-
based mass analyzers and also some ion traps (see the
ural compounds The multidimensional option is considered
acquisition speed of individual analyzers).
not only on the LC side of the LC–MS system, but parallel (multidi-
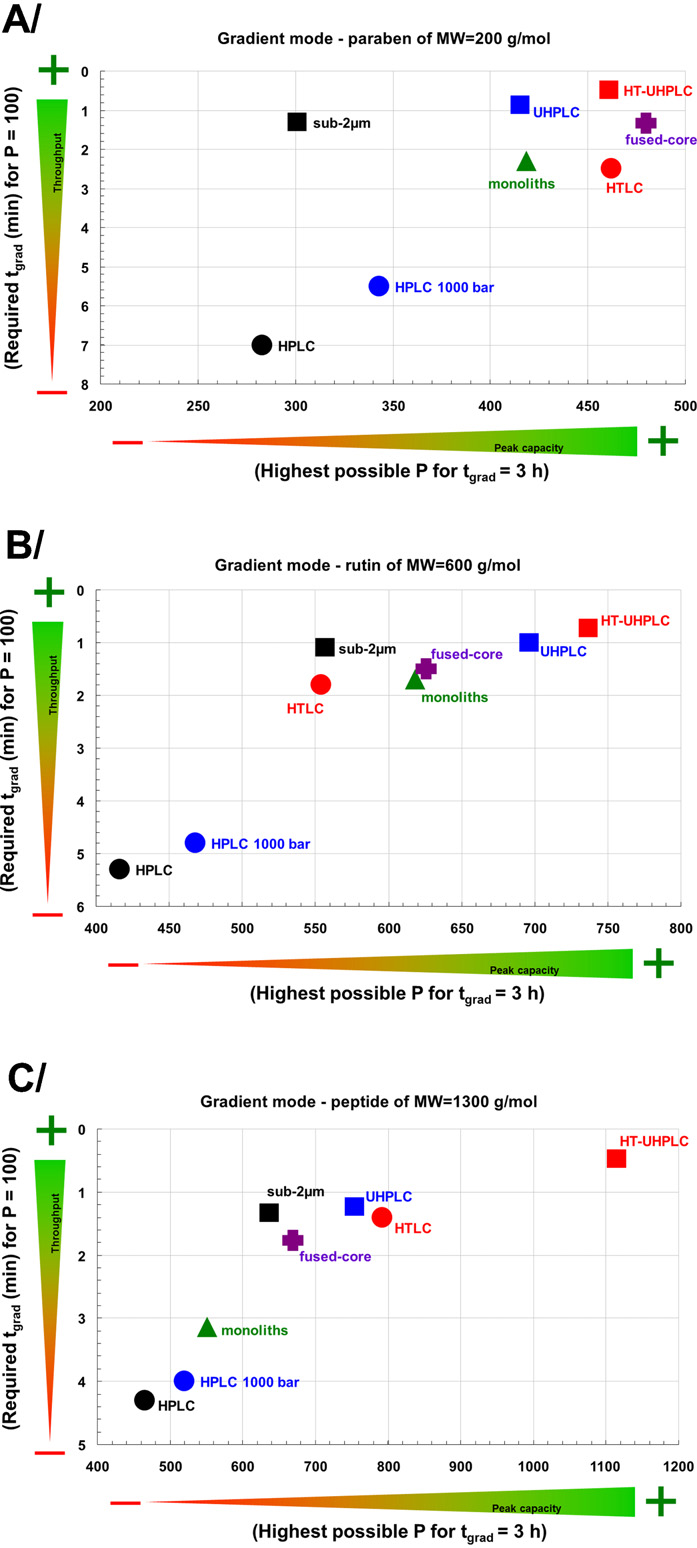
Other approaches used in the fast LC–MS are the use of core-shell
mensional) use of different types of mass spectrometers have been
particles LC (HTLC) mono-
described in LC–MS coupling with the goal to obtain complemen-
lithic columns Several specialized reviews and book
tary information from various MS configurations most
chapters on these novel approaches have been published recently
comprehensive LC–MS system reported so far has been developed
our opinion, the use of core-shell particles with ID <3 m
by Byrdwell for the parallel use of three different mass spectrome-
is highly promising area because comparable results as for
ters (Q-LIT, QqQ and IT) plus three additional non-MS detectors
UHPLC–MS can be obtained on conventional LC–MS systems with-
(UV detector, evaporative light-scattering detector and corona
out the need of additional investments. shows the direct
charged aerosol detector) goal of this "dilute-and-shoot"
comparison of individual approaches in terms of maximum peak
approach is to obtain the maximum amount of analytical informa-
capacity vs. throughput. Detailed comparison and discussion of
tion in a single run, as illustrated on examples of vitamin D3 and
related aspects is available in the original paper
triacylglycerols. Each mass spectrometer is used for obtaining com-
The fastest mass analyzer is obviously the TOF analyzer
plementary information from different scan types, Q-LIT is used for
with common acquisition speeds 10–50 Hz, which fits well with
recording SIM, SRM and enhanced MS scans in APCI mode, QqQ
fast/ultrafast LC requirements. The technical specification of fastest
operates in the full-scan APCI mode, and IT provides information
Q-TOF instrument on the market declares 100 Hz for tandem
mass spectrometry (MS/MS) measurements which allows
Nowadays, important tasks in LC–MS and the analytical
numerous parallel SRM scans even in fast/ultrafast LC–MS. The
chemistry in general are the sample throughput, automation and
fastest TOF instrument for LC–MS reports 200 Hz acquisition speed
non-supervised system operation, because the clinical studies of
The additional parameter important for the quantitation
ten have an enormous number of samples to be analyzed. The
is the linear dynamic range, which is at least 5 orders of magnitude
robotic NanoMate TriVersa system can be used for this purpose in
or better for modern Q, LIT, TOF instruments and their combinations
various operation modes including the automatic liquid extraction
from the tissue surface followed by ESI-MS analysis auto-
mated fraction collection followed by ESI-MS analysis in supervised
3.2. Ionization techniques in LC–MS
or non-supervised mode .
For many decades, the role of chemical derivatization was fully
The status quo in ionization techniques is that nearly all
recognized in gas chromatography–mass spectrometry (GC–MS),
LC–MS systems are equipped with ESI, sometimes accompanied
where the derivatization enabled the analysis of analytes with
by atmospheric pressure chemical ionization (APCI) for less polar
insufficient volatility Now the potential of derivatiza-
compounds and the normal-phase LC operation
tion is also realized in LC–MS to increased sensitivity
shows the relative percentage of individual atmospheric pressure
improved bioanalytical quantitation improved reten-
ionization techniques used in published LC–MS papers accord-
tion behavior of problematic analytes possible integration
ing to the Web of Science search, where the dominant role of
of derivatization of polar analytes and their extraction followed
ESI (82% of papers) is evident. Main application areas of ESI
by LC–MS determination present, planar separation tech-
are in the characterization of biomolecules, ionic and very labile

M. Holˇcapek et al. / J. Chromatogr. A 1259 (2012) 3–15
Fig. 4. Relative use of individual atmospheric pressure ionization techniques in
LC–MS papers based on the Web of Science search from March 1, 2012.
and synthetic polymers (16% of papers, The atmospheric
pressure photoionization (APPI) is less widespread (2% of papers,
compared to two above mentioned ionization techniques,
which can be probably explained by a comparable application range
as for APCI. The application potential of ESI, APCI and ESI was com-
pared for 5 polar pharmaceuticals ESI showed the best
performance in terms of sensitivity and selectivity.
Ionization mechanisms in APPI rather complex con-
sisting of two basic ionization modes: without dopant and with the
assistance of dopant. The ionization process in APPI is initiated by
photons emitted by a discharge lamp (typically krypton, 10 eV and
minor 10.6 eV). These photons ionize compounds with ionization
energies lower than their energy (10 eV), which includes analyte
molecules, but not typical gases and solvents used in LC–MS
separation and nebulization processes. Analyte molecules are
ionized rather selectively without background interferences. The
ionization of analytes is dependent on their ionization energies
rather than their proton affinities unlike to ESI and APCI. Toluene
and acetone are the most common dopants in APPI often providing
significantly better sensitivity for low polar analytes compared to
ESI/APCI techniques. Dopants are first ionized by photoionization
and then they ionize target analytes by ion-molecules reactions,
e.g., by the proton transfer in the positive-ion mode. The presence
of radical molecular ions M+. in positive-ion APPI mode is not rare
unlike to ESI/APCI and they can be formed by direct photoioniza-
tion (conditions without dopant) or charge-exchange mechanisms,
which depend mainly on the solvent polarity, flow rate and the
Fig. 3. Performance comparison of LC strategies in terms of throughput (t
presence of additives Recently, the experimental and
P = 100) and maximum peak capacity (Pmax for tgrad = 3 h) in the gradient elution for
quantum mechanical studies were used to revisit the mechanism
model compounds: (A) butylparaben (MW = 200 Da), (B) rutin (MW = 600 Da), and
of [M+H]+ formation in APPI show that both electron
(C) peptide triptorelin (MW = 1300 Da).
transfer and hydrogen transfer can occur as a concerted reaction
Adapted with a permission from
through the ion-molecular complex precursor state.
The present LC–MS practice moves toward fast/ultrafast LC
organic and organometallic compounds Fundamentals,
analyses for high-throughput, which puts demands on the speed of
instrumentation and biological applications of ESI and MALDI have
mass spectra recording. For numerous applications, mass spectra
been described in a monograph edited by Cole recently
recorded in both polarity modes provide valuable complemen-
the current knowledge on the mechanism of ion formation in ESI
tary information both for qualitative and quantitative analyses,
has been reviewed application potential of APCI is mainly
because certain compound classes can be ionized only in one polar-
in the area of medium polar to non-polar organic compounds
ity mode, e.g., (poly)sulfates and (poly)sulfonates do not provide

M. Holˇcapek et al. / J. Chromatogr. A 1259 (2012) 3–15
a signal in the positive-ion mode unless the presence of other
functional groups with easy ionization in the positive-ion mode
For this reason, the mass spectrometer with a fast polarity
switching is desirable (<50 ms for low-resolution and <1 s for high-
resolution mass analyzers), because the parallel measurement of
both polarity modes can be performed within one run. The fast
polarity switching in case of high-resolution mass analyzers is more
demanding technical task, because the electronics usually need cer-
tain time for the stabilization of high voltages in the range of kV,
so only few high-resolution systems are capable of relatively fast
polarity switching, but the equilibration time of few minutes is
Combined ion sources can be considered as an option merg-
ing the advantages and application ranges of atmospheric pressure
ionization techniques, but on the other hand their sensitivity
may be a compromise between both modes. The advantage of
combined ESI/APCI ESI/APPI ion sources possi-
ble detection of both polar and non-polar analytes in one run,
which can increase the number of identified components for highly
complex matrices, such as traditional Chinese medicine
Fig. 5. Scheme of off-line LC–MALDI-MS coupling with the supplementary liquid
simultaneous detection of cyclodextrins, pharmaceuticals and their
addition and deposition mechanisms. Junctions used for coupling of microcol-
binding interactions combination of APCI, ESI and APPI can
umn techniques include the following: (A) coaxial sheath flow, (B) T-junction, (C)
be useful for combinational chemistry and high-throughput bio-
sheathless interface, (D) porous junction, (E) liquid junction, and (F) droplet elec-
trocoupling. A, B and C are typical for capillary LC–MS, while D, E and F are common
logical screening. ESI can normally analyze around 80% of samples,
in capillary zone electrophoresis–MS.
which can be complemented by combined source operating with
Reprinted with a permission from
the polarity switching within a single run combined ion
source with a computer-controlled switch between MALDI and ESI
modes in the ICR configuration has been developed with a possible
some authors report comparable results for stable-isotope-labeled
exchange between ESI and MALDI in less than 1 min
proteomic quantitation Due to the complex character of
studied proteomic samples, one-dimensional chromatography is
3.3. LC–MALDI-MS coupling
often not sufficient and multidimensional separation approaches
are needed for the adequate fractionation of studied samples
LC–MALDI-MS coupling has some specific advantages over
e.g., the combination of orthogonal separation
LC–ESI-MS, mainly the possibility of decoupling of separation and
principles of ion-exchange and reversed phase LC
mass analysis steps, which allows re-analysis of peaks of inter-
For on-line LC–MALDI-MS coupling effluent from
est later on, lower suppression effects (possibility to use more
LC is delivered directly to the mass spectrometer. Contrary to
harsh LC conditions compared to LC–ESI-MS) and high m/z range
off-line coupling devices, on-line devices are not yet commer-
of TOF mass analyzer. On the other hand, the critical step in
cially available. Methods for the liquid sample introduction can be
LC–MALDI-MS coupling is the transfer of effluent from LC exit to
performed by continuous-flow MALDI using frits, aerosol MALDI,
the MALDI plate and matrix introduction, which may be responsi-
moving wheel or moving (rotating) ball methods, but these appli-
ble for certain band broadening. Off-line and on-line approaches in
cations are more common for the MALDI coupling with capillary
LC–MALDI-MS coupling have been described for capillary LC
separations on microfluidic chips
used off-line methods are based on the deposition of LC effluent
3.4. Ion mobility spectrometry
on the MALDI plate using a continuous trace or discrete spots.
The continuous sample deposition is better for preserving the
Ion mobility spectrometry (IMS) was developed over the past
chromatographic resolution. The MALDI targets with pre-coated
few decades as a method for the separation and subsequent detec-
matrix are easier for the sample preparation than mixing the LC
tion of volatile and semi-volatile organic compounds. IMS enables
effluent with matrix. Liquid samples can be also applied on spe-
the differentiation of ions by size, shape, charge as well as mass,
cial nanostructured surfaces used in matrix-free approaches
which can provide important supplementary information to the
The deposition of continuous streak (called in-line coupling) or
chromatographic separation of molecules and mass spectrometric
discrete fractions can be accomplished using laboratory-built or
separation of ions. Detailed description of ion mobility principles
commercial robotic spotters. The spotting on the MALDI target
have been discussed previously principle, the sepa-
plate is achieved in several ways, i.e., most frequently contact
ration of gas-phase ions at atmospheric pressure is based on their
deposition (using T-junction), spray deposition (electrospray, neb-
different mobilities in the low or high electric fields. Four methods
ulizer), electric pulse deposition, impulse driven deposition, heated
of ion mobility separation can be combined with MS, i.e., drift-
droplet interface or piezoelectric microdispensor
time ion mobility spectrometry (DTIMS), aspiration ion mobility
line approach is often used in proteomics (e.g., analysis of protein
spectrometry (AIMS), differential-mobility spectrometry (DMS)
digests of post-translational modifications
also called field-asymmetric waveform ion mobility spectrometry
etc.), but applications in small molecule syn-
(FAIMS) and traveling-wave ion mobility spectrometry (TWIMS).
thetic polymer analysis be also found, typically with
Only TWIMS and DMS/FAIMS are commercially available in the
microparticular monolithic columns MALDI is
LC–MS coupling so far construction of TWIMS originates
less prone to the ion suppression effects than ESI has higher
from the traditional IMS analogous to the TOF separation, where
throughput for a large number of deposited samples and higher tol-
formed ions are moved to the drift region via a shutter grid. These
erance toward salts and buffers. In general, MALDI is known as less
ions are then separated based on different ion mobilities in a
convenient for the quantitative analysis unlike to LC–ESI-MS, but
weak electric field with the opposite direction of the inert gas

M. Holˇcapek et al. / J. Chromatogr. A 1259 (2012) 3–15
Fig. 7. 3D plot of retention times in the LC separation, m/z values in the MS separa-
tion and drift times in the ion mobility separation of proteins obtained by LC–IMS-MS
Fig. 6. Principles of ion mobility separation of ions in: (A) traveling-wave ion
Reprinted with a permission from
mobility spectrometry (TWIMS) including the scheme of time-aligned parallel
(TAP) fragmentation and (B) field-asymmetric waveform ion mobility spectrometry
ground compounds and cluster ions from doubly charged ions with
Adapted with a permission from
the aim to simplify the spectra). The reduction of interferences fol-
lowed by increased selectivity can be further enhanced by the use of
flow. Unlike the traditional IMS, where the low electric field is
suitable volatile chemical modifier (called dopant)
applied continuously on the cell, a sequence of symmetric potential
advantage results in the reduced chemical noise, increased dynamic
waves (high-field) is continuously applied through the series of
range and enhanced peak separation, and it is closely associated
segmented electrodes of cell in the same direction with the ion
with chemical properties of used dopant and its concentration.
migration Ions are introduced from Q at reduced
MALDI and ESI are commonly used in IMS-MS. Due to the easy cou-
pressure, and their motion in the electric field of IMS cell depends
pling with LC and possible ionization of less volatile compounds,
on particular ion mobilities (On the contrary, the ion
the ESI is the best choice for LC–IMS-MS applications
mobility device for DMS/FAIMS is placed in the ion source region
In principle, all types of mass analyzers can be used after the ion
and ions are separated under ambient conditions. DMS/FAIMS
mobility separation. The commercial solution of TWIMS is followed
works as a scan filter and sorts ions by the difference between
by TOF-MS, while DMS/FAIMS forms a part of the ion source and
ion mobilities at high and low electric field with the opposite
can be combined with any type of mass analyzer.
polarity, induced by a periodic asymmetric field (application of
The ion mobility separation is different compared to chromato-
so called separation or dispersion voltage) orthogonal to the ion
graphic and mass spectrometric separations, and the combination
path. The different mobility of ions during the application of high
of these separation modes provides a better resolution for com-
and low voltages causes the ion drift toward one of two electrodes
plex samples. Three-dimensional data set consists retention times,
trajectory of particular ions along the radial axis
drift times and m/z values, as illustrated in the 3D separa-
can be corrected using the application of compensation voltage
tion of peptide digest of human plasma proteome use
to avoid ion discharge (This approach is similar to the
of MS/MS provides an additional level of structural information.
Q filtering. DMS and FAIMS instruments are based on the same
In addition to traditional collision-induced dissociation (CID), new
principle of ion separation, but they differ in the instrumental
fragmentation approaches have been introduced by Waters, such
design. Electrodes are not segmented and the alternating electric
as energy dependent fragmentation (MSE) and time-aligned par-
field is placed between two electrodes (plate electrodes for DMS
allel (TAP) fragmentation. MSE can be applied in all tandem mass
vs. cylindrical electrodes for FAIMS).
spectrometers, while application of TAP is restricted to IMS instru-
Instruments equipped with the ion mobility spectrometry (IMS)
ments. The TWIMS ion mobility separation plays an important role
were commercially introduced by Waters in 2006 (TWIMS) and
in TAP approach (The precursor ion is fragmented in the
now they are also provided by Thermo Scientific (FAIMS) and AB
trap with subsequent separation of the first generation of product
SCIEX (DMS). IMS can be applied for the separation of isobaric com-
ions by IMS. The second generation of fragment ions is formed in the
pounds (on condition that their cross-sections differ at least by
transfer, and they are associated to the first generation parent based
about 3%), the reduction of high background noise, the separation of
on individual drift-times combination of IMS and MS
endogenous matrix interferences from target analytes to increase
with high-RP and advanced fragmentation experiments (MSn, elec-
the selectivity and enables the charge state screening used mainly
tron transfer/capture dissociation, MSE or TAP) is a powerful tool
in proteomics (the separation of unwanted singly charged back-
for the structural determination.
M. Holˇcapek et al. / J. Chromatogr. A 1259 (2012) 3–15
The ion mobility MS was mainly associated with the analysis
spectra (SWATH) mode in which sequential precursor ions win-
of volatile compounds for homeland security and environmental
dows (typically 20 m/z) are used to collect the same spectrum
applications, such as explosives, chemical warfare agents, chemical
precursor and fragment ions using a collision energy range. High-
pollutants or drugs detection. The LC sample introduction followed
resolution SRM (HR-SRM) on a rapid acquisition (<50 ms) Q-TOF
by ESI has extended the range of applications to the field of biolog-
instrument with the resolving power above 20,000 leads to new
ical, biomedical and pharmaceutical research wide range
possibilities in the integrated quantitative and qualitative bioanal-
of applications for LC–IMS-MS can be found in the literature, e.g.,
profiling of plasma proteome of isomeric transforma-
MALDI couple to TOF analyzer is not a typical method of choice
tion of phenolic compounds present in foodstuff
for the quantitative analyses due to worse scan to scan repro-
of indole alkaloids in yohimbe bark high-throughput pro-
ducibility, but the coupling of MALDI with QqQ mass analyzers
teomic studies of rat urinary metabonome
combines important advantages of both approaches. MALDI is the
of separation of drug-related materials
ultrafast technique without the need of chromatographic separa-
drug metabolism study The 2D-LC–IMS-MS coupling has
tion, while QqQ with SRM is the best technique for the sensitive
a great potential in the biomarker discovery due to the possible
quantitation usefulness of MALDI-QqQ configuration in
orthogonal character of these separation techniques in liquid and
the quantitative analysis has been demonstrated on the ultrafast
gas phase, as illustrated on the example of 8 pharmaceutical com-
quantitation (6 s for one sample) of selected drugs pro-
pounds with the identical nominal mass m/z 316 can
teomic analysis et al. reported MALDI SRM
separate these molecules in a liquid-phase, ultrahigh-RP MS can
quantitation on QqQ mass analyzer may be a serious alternative to
separate their protonated molecules in a gas-phase according to
established LC–ESI-MS methods in terms of linearity, limit of quan-
their accurate m/z values, while IMS separates them according to
titation, precision and accuracy. However, MALDI assay was at least
their size-to-charge ratio.
50 times faster than LC–ESI-MS.
Another important issue is the sample preparation preceding
3.5. Mass spectrometric quantitation
LC–MS analysis Obviously, the internal standard must
be added before any sample pre-concentration step. The LC–MS
The QqQ mass analyzer with SRM scans is a golden standard
quantitation approach has a clear advantage in terms of reduced
in any mass spectrometric quantitation either in the LC–MS con-
ion suppression effects, trace analysis and retention times bring
figuration or MS stand-along systems All MS quantitation
an additional dimension in the selectivity. On the other hand,
approaches obviously require the use of internal standards to elim-
advantages of shot-gun approach (typically used for example in
inate any possible variations during the ionization process and
lipidomics) are mainly the analysis speed and simplicity. The
the mass analysis, such as the ion suppression/enhancement, the
fastest QqQ mass analyzers enable the determination of numerous
contamination of the ion source or the mobile phase, etc., extrac-
species within few minutes without any chromatographic sepa-
tion losses or any other unpredictable reasons. The best internal
ration, but the information on isobaric species with the identical
standard in MS and LC–MS is the addition of isotopically labeled
fragmentation pattern is lost. In the quantitation of complex pro-
analogs, where all physico-chemical properties including the reten-
tein mixtures, the isotope-coded affinity tags (ICAT) approach
tion behavior, fragmentation behavior and extraction efficiency are
and related tag techniques are often used alter-
almost identical except for characteristic mass shifts caused by the
native approach for the relative quantitation is the use of response
number of labeled isotopes. For higher number of deuterium atoms
factors determined from the calibration curves of pure standards
(at least about 5), small shifts in retention times can occur, but it
and then applied for real samples internal standard
does not constitute any problem in the LC–MS quantitation. The ion
addition and response factors approach can be combined in one
suppression/enhancement effects play an important role in LC–MS
platform together with well-optimized chromatographic separa-
quantitation and the extend of these effects needs to be quantita-
tion, as illustrated on the lipidomic class quantitation The
tively assessed, as suggested in few recent works
stable isotope labeling by amino acids in cell culture (SILAC)
The novel approach for LC–MS quantitation uses
is a simple approach for the incorporation of the isotopic label into
ultrahigh-RP in the full-scan single stage mode using reconstructed
proteins for MS-based quantitative proteomics. Two cell popula-
ion currents for very narrow extraction windows (e.g., 5 ppm
tions are grown in the culture media that are identical except for
around the theoretical m/z value). This approach provided com-
light (non-labeled) and heavy (labeled with deuterium, 13C or 15N)
parable detection specificity, assay precision, accuracy, linearity
form of a particular amino acid, which is incorporated into the
and sensitivity for 17 therapeutic drugs as for the conventional
SRM acquisition on QqQ without the need of the optimization of
MS/MS parameters for SRM transitions. The full-scan mass spectra
information is still retained unlike SRM measurements, which can
4. Mass spectrometric approaches complementary to
be beneficial for the detection of co-eluting species, unexpected
adducts of analytes, etc.
The recent trend in MS based quantitation is an integrated
In the last decade, several new approaches designed for the
quantitative and qualitative bioanalysis which essentially
direct mass spectrometric analysis at ambient conditions without
requires the use of high-resolution tandem mass analyzers cou-
the chromatographic separation have been introduced. The main
pled to LC (preferably in fast LC mode). Hybrid FT tandem mass
advantage of such approaches is the fast analysis without any (or
analyzers are convenient for this purpose due to the ability to col-
minimum) sample preparation, which significantly increases the
lect full-scan high-RP mass spectra at scan speeds required for
sample throughput. On the other hand, some drawbacks must be
UHPLC together with routine measurements of MA <5 ppm
also mentioned in terms of reduced amount of analytical informa-
Another possibility is the use of the following acquisition schemes
tion due to the absence of separation and sample preparation steps.
on Q-TOF mass analyzer (1) information-dependent acqui-
The ion suppression and matrix effects can cause severe problems
sition with TOF survey scan and product-ion scan as dependent
with the quantitation and the trace analysis.
scan, (2) MSALL by collecting TOF mass spectra with and without
The term ambient ionization technique has been first intro-
fragmentation by alternating low and high collision energy, and
duced by Takáts et al. now there is an explosion of
(3) sequential window acquisition of all theoretical fragment-ion
new ambient ionization techniques and associated acronyms
M. Holˇcapek et al. / J. Chromatogr. A 1259 (2012) 3–15
Fig. 9. Surgical mass spectrometry: scheme of ion transfer from the tissue to the
atmospheric interface to mass spectrometer.
Reprinted with a permission from
tissues another interesting application of MS has
been published and referred as rapid evaporation ionization mass
spectrometry (REIMS) (the electrosurgical dis-
section, the tissue is locally exposed to high-frequency electric
current resulting in the ionization of molecules contained in this
Fig. 8. Typical applications of MALDI mass spectrometry imaging in proteomics,
lipidomics and drug metabolites.
tissue, preferably lipids. The lipidomic composition of dissected
Reprinted with a permission from
tissue can be obtained within less than second and used for the
verification of tissue type (cancer vs. healthy tissue)
The main group is a family of ambient desorption
5. Current state and future trends
ionization techniques, such as desorption ESI (DESI)
desorption APCI (DAPCI) desorption APPI (DAPPI)
Some trends in the area of LC–MS and related techniques
The direct analysis in real time (DART) is the name of ionization
are already recognized now: (A) the shift from low-resolution
technique introduced by JEOL the soft ionization of analyte
to (ultra)high-resolution tandem mass analyzers providing high-
molecules on surfaces, in liquid-phase or gases without any sample
MA below 1 ppm, (B) the shift from conventional HPLC–MS to
preparation. The Penning ionization mechanism describes based
UHPLC–MS or other fast LC–MS techniques (core–shell particles,
on interactions between excited helium atoms and target analyte
high-temperature LC and monolithic columns) requiring fast MS
at ambient conditions. Another ionization technique applicable for
analyzers (typically TOF based systems), (C) the use of 2D-LC–MS
different types of gaseous, liquid and solid samples is termed the
for complex samples, and (D) other dimension also in MS, such as
atmospheric solids probe analysis (ASAP) ASAP and DESI
IMS-MS, parallel use of more mass spectrometers, ionization tech-
can be combined in one ionization source which extends
niques and polarity modes. Present LC–MS systems generate huge
the range of analyte compounds in terms of their polarities and
amounts of analytical data, which is often impossible to interpret
molecular weights. Recently, the paper spray ionization has been
manually, so dedicated softwares can help with the automation of
described, where the analyte (e.g., the whole blood) is spotted on
data processing and interpretation significant impact on
the paper (so called dry blood spot analysis then the selected
the whole mass spectrometric community had the invention
solvent is automatically added, and the solution is electrosprayed
and commercialization of the sixth type of mass analyzer—Orbitrap.
from the paper into the mass spectrometer technique is
The notable improvement has been recently reported in the field of
intended for high-throughput clinical analyses. The new ionization
ICR cell construction, where Nikolaev et al. the
technique solvent based direct inlet MS suitable for both
RP exceeding 24 millions, which shifts the limits of MS. Ground-
small and large molecules in solids or liquid solvents including in
breaking news (such as the discovery of new type of mass analyzer)
LC–MS configuration. The principle of this ionization technique
are not probable in the near future, but such discoveries cannot be
is based on the heated inlet used for reversed-phase system with
anticipated. On the other hand, improvements in the area of ion-
some similarity to former thermospray ionization, but author
ization techniques, ion optics, fast electronics, dedicated scans and
report better sensitivity and applicability to peptides.
consequently the sensitivity and selectivity will certainly continue.
Promising MS techniques designed for the determination of
spatial distribution of analyte molecules on the surface is mass
spectrometry imaging (MSI) is typically used for
the spatial imaging of biomolecules in biological tissues. At present,
the spatial resolution of MALDI-MSI is routinely in the range of
Authors would like to express gratitude to numerous colleagues
tens micrometers reported values are below 5 m
and company representatives for their help with the compilation
secondary ion mass spectrometry (SIMS) can provide
of tables and critical reading of the manuscript as well as to anony-
the spatial resolution even below 1 m additional
mous reviewers for their insightful comments.
level of information can be obtained by 3D spatial imaging of bio-
logical tissues using SIMS Most typical application areas
of MSI (are lipidomics the distribution of
[1] W.M.A. Niessen, J. Chromatogr. A 794 (1998) 407.
drugs and other small molecules in tissues while the
[2] W.M.A. Niessen, J. Chromatogr. A 856 (1999) 179.
number of MSI papers in proteomics is slightly lower due to the
[3] M. Himmelsbach, J. Chromatogr. B 883 (2012) 3.
sensitivity limitations and essential removal of abundant lipids
[4] Y. Liang, G.J. Wang, L. Xie, L.S. Sheng, Curr. Drug Metab. 12 (2011) 329.
[5] W.M.A. Niessen, J. Chromatogr. A 1000 (2003) 413.
The MSI with high spatial resolution has been sug-
[6] , downloaded on 11.01.12.
gested as an alternative technique to the histological staining of
[7] downloaded on 11.01.12.
M. Holˇcapek et al. / J. Chromatogr. A 1259 (2012) 3–15
[8] , downloaded on 11.01.12.
[74] D. Guillarme, J. Schappler, S. Rudaz, J.L. Veuthey, Trends Anal. Chem. 29 (2010)
[9] , downloaded on 11.01.12.
[10] downloaded on 11.01.12.
[75] Y.F. Cheng, Z. Lu, U. Neue, Rapid Commun. Mass Spectrom. 15 (2001) 141.
[11] downloaded on 11.01.12.
[76] E. Uliyanchenko, P.J. Schoenmakers, S. van der Wal, J. Chromatogr. A 1218
[12] downloaded on 11.01.12.
(2011) 1509.
[13] downloaded on 11.01.12.
[77] K.K. Unger, R. Skudas, M.M. Schulte, J. Chromatogr. A 1184 (2008) 393.
[14] downloaded on 11.01.12.
[78] E. Olah, S. Fekete, J. Fekete, K. Ganzler, J. Chromatogr. A 1217 (2010) 3642.
[15] downloaded on 11.01.12.
[79] D.T.T. Nguyen, D. Guillarme, S. Heinisch, M.P. Barrioulet, J.L. Rocca, S. Rudaz,
[16] , downloaded on 11.01.12.
J.L. Veuthey, J. Chromatogr. A 1167 (2007) 76.
[17] downloaded on 12.07.12.
[80] S. Heinisch, J.L. Rocca, J. Chromatogr. A 1216 (2009) 642.
[18] K.K. Murray, J. Chromatogr. A 1217 (2010) 3922.
[81] R. Wu, L.G. Hu, F.J. Wang, M.L. Ye, H. Zou, J. Chromatogr. A 1184 (2008) 369.
[19] O.D. Sparkman, Mass Spectrometry Desk Reference, Global View Publishing,
[82] S. El Deeb, Chromatographia 74 (2011) 681.
Pittsburgh, 2000.
[83] D. Guillarme, J. Ruta, S. Rudaz, J.L. Veuthey, Anal. Bioanal. Chem. 397 (2010)
[20] J. Barker, Mass Spectrometry, Second ed., J. Wiley & Sons, Chichester, 1999.
[21] R.B. Cole, Electrospray and MALDI Mass Spectrometry, Second ed., J. Wiley &
[84] M. Lísa, H. Velínská, M. Holˇcapek, Anal. Chem. 81 (2009) 3903.
Sons, Chichester, 2010.
[85] M. Lísa, M. Holˇcapek, J. Chromatogr. A 1198 (2008) 115.
[22] E. de Hoffmann, V. Stroobant, Mass Spectrometry: Principles and Applications,
[86] M. Holˇcapek, R. Jirásko, M. Lísa, J. Chromatogr. A 1217 (2010) 3908.
Third ed., John Wiley & Sons Ltd., Chichester, 2007.
[87] M. Holˇcapek, H. Dvoˇráková, M. Lísa, A.J. Giron, P. Sandra, J. Cvaˇcka, J. Chro-
[23] W. Henderson, J.S. McIndoe, Mass Spectrometry of Inorganic and
matogr. A 1217 (2010) 8186.
Organometallic Compounds, J. Wiley & Sons, Chichester, 2005.
[88] R. Jirásko, M. Holˇcapek, Mass Spectrom. Rev. 30 (2011) 1013.
[24] J.V. Olsen, L.M.F. de Godoy, G.Q. Li, B. Macek, P. Mortensen, R. Pesch, A.
[89] P. Kebarle, U.H. Verkerk, Mass Spectrom. Rev. 28 (2009) 898.
Makarov, O. Lange, S. Horning, M. Mann, Mol. Cell. Proteomics 4 (2005) 2010.
[90] A. Garcia-Ac, P.A. Segura, L. Viglino, C. Gagnon, S. Sauve, J. Mass Spectrom. 46
[25] J. Cox, A. Michalski, M. Mann, J. Am. Soc. Mass Spectrom. 22 (2011) 1373.
[26] V.V. Mihaleva, O. Vorst, C. Maliepaard, H.A. Verhoeven, R.C.H. de Vos, R.D. Hall,
[91] J.A. Syage, J. Am. Soc. Mass Spectrom. 15 (2004) 1521.
R. van Ham, Metabolomics 4 (2008) 171.
[92] L.C. Short, S.S. Cai, J.A. Syage, J. Am. Soc. Mass Spectrom. 18 (2007) 589.
[27] A.G. Chambers, J.M. Ramsey, Anal. Chem. 84 (2012) 1446.
[93] A. Ahmed, C.H. Choi, M.C. Choi, S. Kim, Anal. Chem. 84 (2012) 1146.
[28] , downloaded on 11.01.12.
[94] Y. Zhou, Y. Wang, R.F. Wang, F. Guo, C. Yan, J. Sep. Sci. 31 (2008) 2388.
[29] Y. Pico, C. Blasco, M. Farre, D. Barcelo, J. AOAC Int. 92 (2009) 734.
[95] L.C. Short, J.A. Syage, Rapid Commun. Mass Spectrom. 22 (2008) 541.
[30] C. Soler, B. Hamilton, A. Furey, K.J. James, J. Manes, Y. Pico, Rapid Commun.
[96] R.T. Gallagher, M.P. Balogh, P. Davey, M.R. Jackson, I. Sinclair, L.J. Southern,
Mass Spectrom. 20 (2006) 2151.
Anal. Chem. 75 (2003) 973.
[31] O.J. Pozo, P. Van Eenoo, K. Deventer, H. Elbardissy, S. Grimalt, J.V. Sancho, F.
[97] G. Baykut, J. Fuchser, M. Witt, G. Weiss, C. Gosteli, Rapid Commun. Mass
Hernandez, R. Ventura, F.T. Delbeke, Anal. Chim. Acta 684 (2011) 107.
Spectrom. 16 (2002) 1631.
[32] T. Rousu, J. Herttuainen, A. Tolonen, Rapid Commun. Mass Spectrom. 24
[98] M. Lasaosa, N. Delmotte, C.G. Huber, K. Melchior, E. Heinzle, A. Tholey, Anal.
Bioanal. Chem. 393 (2009) 1245.
[33] F. Hernandez, M. Ibanez, J.V. Sancho, O.J. Pozo, Anal. Chem. 76 (2004) 4349.
[99] O. Peˇs, J. Preisler, J. Chromatogr. A 1217 (2010) 3966.
[34] R.J. Wenzel, U. Matter, L. Schultheis, R. Zenobi, Anal. Chem. 77 (2005) 4329.
[100] H. Wei, K. Nolkrantz, M.C. Parkin, C.N. Chisolm, J.P. O‘Callaghan, R.T. Kennedy,
[35] A. Holle, A. Haase, M. Kayser, J. Hohndorf, J. Mass Spectrom. 41 (2006) 705.
Anal. Chem. 78 (2006) 4342.
[36] S. Berkenkamp, F. Kirpekar, F. Hillenkamp, Science 281 (1998) 260.
[101] D.L. Devoe, C.S. Lee, Electrophoresis 27 (2006) 3559.
[37] E.N. Nikolaev, I.A. Boldin, R. Jertz, G. Baykut, J. Am. Soc. Mass Spectrom. 22
[102] J. Lee, S.A. Soper, K.K. Murray, J. Mass Spectrom. 44 (2009) 579.
(2011) 1125.
[103] C.W. Tsao, S. Tao, C.F. Chen, J.K. Liu, D.L. DeVoe, Microfluid. Nanofluid. 8 (2010)
[38] B. Bogdanov, R.D. Smith, Mass Spectrom. Rev. 24 (2005) 168.
[39] R.P. Rodgers, T.M. Schaub, A.G. Marshall, Anal. Chem. 77 (2005) 20a.
[104] K. Marcus, H. Schafer, S. Klaus, C. Bunse, R. Swart, H.E. Meyer, J. Proteome Res.
[40] A.G. Marshall, R.P. Rodgers, Accounts Chem. Res. 37 (2004) 53.
6 (2007) 636.
[41] D. Ohta, S. Kanaya, H. Suzuki, Curr. Opin. Biotechnol. 21 (2010) 35.
[105] E. Mirgorodskaya, C. Braeuer, P. Fucini, H. Lehrach, J. Gobom, Proteomics 5
[42] H.Y. Wang, X. Chu, Z.X. Zhao, X.S. He, Y.L. Guo, J. Chromatogr. B 879 (2011)
[106] J. Wohlgemuth, M. Karas, T. Eichhorn, R. Hendriks, S. Andrecht, Anal. Biochem.
[43] T. Pluskal, T. Uehara, M. Yanagida, Anal. Chem. 84 (2012) 4396.
395 (2009) 178.
[44] J.P. Kutter, J. Chromatogr. A 1221 (2012) 72.
[107] E.S. Kuznetsova, A.K. Buryak, G.A. Petukhova, Chromatographia 73 (2011) S55.
[45] S. Koster, E. Verpoorte, Lab Chip 7 (2007) 1394.
[108] G. Montaudo, F. Samperi, M.S. Montaudo, Prog. Polym. Sci. 31 (2006) 277.
[46] N.V. Lavrik, L.T. Taylor, M.J. Sepaniak, Anal. Chim. Acta 694 (2011) 6.
[109] S.M. Weidner, J. Falkenhagen, Anal. Chem. 83 (2011) 9153.
[47] S.L. Lin, H.Y. Bai, T.Y. Lin, M.R. Fuh, Electrophoresis 33 (2012) 635.
[110] M.X. Gao, J. Zhang, C.H. Deng, P.Y. Yang, X.M. Zhang, J. Proteome Res. 5 (2006)
[48] M. Holˇcapek, H. Velínská, M. Lísa, P. ˇ
Cesla, J. Sep. Sci. 32 (2009) 3672.
[49] M. Lísa, E. Cífková, M. Holˇcapek, J. Chromatogr. A 1218 (2011) 5146.
[111] F. Gosetti, E. Mazzucco, D. Zampieri, M.C. Gennaro, J. Chromatogr. A 1217
[50] P. Dugo, F. Cacciola, T. Kumm, G. Dugo, L. Mondello, J. Chromatogr. A 1184
(2010) 3929.
[112] M.A. Kuzyk, L.B. Ohlund, M.H. Elliott, D. Smith, H. Qian, A. Delaney, C.L. Hunter,
[51] F. Cacciola, P. Jandera, E. Bláhová, L. Mondello, J. Sep. Sci. 29 (2006) 2500.
C.H. Borchers, Proteomics 9 (2009) 3328.
[52] T. Hájek, V. ˇSkeˇríková, P. ˇ
nuchalová, P. Jandera, J. Sep. Sci. 31 (2008)
[113] X. Gu, C.H. Deng, G.Q. Yan, X.M. Zhang, J. Proteome Res. 5 (2006) 3186.
[114] C.L. Liu, X.M. Zhang, J. Chromatogr. A 1139 (2007) 191.
[53] T. Hyotylainen, T. Andersson, M. Jussila, S.K. Wiedmer, M. Rautiainen, M.L.
[115] H. Orsnes, R. Zenobi, Chem. Soc. Rev. 30 (2001) 104.
Riekkola, J. Sep. Sci. 24 (2001) 544.
[116] K.K. Murray, Mass Spectrom. Rev. 16 (1997) 283.
[54] P. Donato, F. Cacciola, L. Mondello, P. Dugo, J. Chromatogr. A 1218 (2011) 8777.
[117] C.W. Huck, R. Bakry, L.A. Huber, G.K. Bonn, Electrophoresis 27 (2006) 2063.
[55] X.H. Guo, E. Lankmayr, Bioanalysis 2 (2010) 1109.
[118] H. Borsdorf, T. Mayer, M. Zarejousheghani, G.A. Eiceman, Appl. Spectrosc. Rev.
[56] X.L. Han, K. Yang, R.W. Gross, Mass Spectrom. Rev. 31 (2012) 134.
46 (2011) 472.
[57] W.C. Byrdwell, W.E. Neff, Rapid Commun. Mass Spectrom. 16 (2002) 300.
[119] A.B. Kanu, P. Dwivedi, M. Tam, L. Matz, H.H. Hill, J. Mass Spectrom. 43 (2008)
[58] W.C. Byrdwell, Anal. Bioanal. Chem. 401 (2011).
[59] V. Kertesz, G.J. Van Berkel, J. Mass Spectrom. 45 (2010) 252.
[120] B.M. Kolakowski, Z. Mester, Analyst 132 (2007) 842.
[60] K. Schuhmann, R. Almeida, M. Baumert, R. Herzog, S.R. Bornstein, A.
[121] I. Marquez-Sillero, E. Aguilera-Herrador, S. Cardenas, M. Valcarcel, Trends
Shevchenko, J. Mass Spectrom. 47 (2012) 96.
Anal. Chem. 30 (2011) 677.
[61] P. Huˇsek, P. ˇSimek, P. Hartvich, H. Zahradníˇcková, J. Chromatogr. A 1186 (2008)
[122] R.M. O‘Donnell, X.B. Sun, P.D. Harrington, Trends Anal. Chem. 27 (2008) 44.
[123] A.A. Shvartsburg, A.J. Creese, R.D. Smith, H.J. Cooper, Anal. Chem. 82 (2010)
[62] P. ˇSimek, P. Huˇsek, H. Zahradníˇcková, Anal. Chem. 80 (2008) 5776.
[63] F.G. Xu, L. Zou, Y. Liu, Z.J. Zhang, C.N. Ong, Mass Spectrom. Rev. 30 (2011) 1143.
[124] J.H. Sun, A. Baker, P. Chen, Rapid Commun. Mass Spectrom. 25 (2011)
[64] M. Niwa, Bioanalysis 4 (2012) 213.
[65] P. Deng, Y. Zhan, X.Y. Chen, D.F. Zhong, Bioanalysis 4 (2012) 49.
[125] S.J. Valentine, M.D. Plasencia, X.Y. Liu, M. Krishnan, S. Naylor, H.R. Udseth, R.D.
[66] M. Holˇcapek, H. Virelizier, J. Chamot-Rooke, P. Jandera, C. Moulin, Anal. Chem.
Smith, D.E. Clemmer, J. Proteome Res. 5 (2006) 2977.
71 (1999) 2288.
[126] X.Y. Liu, S.J. Valentine, M.D. Plasencia, S. Trimpin, S. Naylor, D.E. Clemmer, J.
[67] J. Cimlová, P. Kruˇzberská, Z. ˇSvagera, P. Huˇsek, P. ˇSimek, J. Mass Spectrom. 47
Am. Soc. Mass Spectrom. 18 (2007) 1249.
[127] C. Xie, K. Yu, D.F. Zhong, T. Yuan, F. Ye, J.A. Jarrell, A. Millar, X.Y. Chen, J. Agric.
[68] T. Tuzimski, J. Chromatogr. A 1218 (2011) 8799.
Food Chem. 59 (2011) 11078.
[69] S.P. Pasilis, G.J. Van Berkel, J. Chromatogr. A 1217 (2010) 3955.
[128] E.S. Baker, E.A. Livesay, D.J. Orton, R.J. Moore, W.F. Danielson, D.C. Prior, Y.M.
[70] B. Fuchs, R. Suss, K. Teuber, M. Eibisch, J. Schiller, J. Chromatogr. A 1218 (2011)
Ibrahim, B.L. LaMarche, A.M. Mayampurath, A.A. Schepmoes, D.F. Hopkins,
K.Q. Tang, R.D. Smith, M.E. Belov, J. Proteome Res. 9 (2010) 997.
[71] D. Guillarme, J.L. Veuthey (Eds.), UHPLC in Life Sciencies, The Royal Society of
[129] E.L. Harry, D.J. Weston, A.W.T. Bristow, I.D. Wilson, C.S. Creaser, J. Chromatogr.
Chemistry, Cambridge, 2012.
B 871 (2008) 357.
[72] L. Nováková, H. Vlˇcková, Anal. Chim. Acta 656 (2009) 8.
[130] C. Eckers, A.M.F. Laures, K. Giles, H. Major, S. Pringle, Rapid Commun. Mass
[73] L. Nováková, L. Matysová, P. Solich, Talanta 68 (2006) 908.
Spectrom. 21 (2007) 1255.
M. Holˇcapek et al. / J. Chromatogr. A 1259 (2012) 3–15
[131] G.J. Dear, J. Munoz-Muriedas, C. Beaumont, A. Roberts, J. Kirk, J.P. Williams, I.
[158] M. Haapala, J. Pól, V. Saarela, V. Arvola, T. Kotiaho, R.A. Ketola, S. Franssila, T.J.
Campuzano, Rapid Commun. Mass Spectrom. 24 (2010) 3157.
Kauppila, R. Kostiainen, Anal. Chem. 79 (2007) 7867.
[132] E. Varesio, J.C.Y. Le Blanc, G. Hopfgartner, Anal. Bioanal. Chem. 402 (2012)
[159] R.B. Cody, J.A. Laramee, H.D. Durst, Anal. Chem. 77 (2005) 2297.
[160] C.N. McEwen, R.G. McKay, B.S. Larsen, Anal. Chem. 77 (2005) 7826.
[133] G. Hopfgartner, E. Varesio, Trends Anal. Chem. 24 (2005) 583.
[161] J.A. Lloyd, A.F. Harron, C.N. McEwen, Anal. Chem. 81 (2009) 9158.
[134] B.K. Matuszewski, M.L. Constanzer, C.M. Chavez-Eng, Anal. Chem. 75 (2003)
[162] W.K. Li, F.L.S. Tse, Biomed. Chromatogr. 24 (2010) 49.
[163] H. Wang, J.J. Liu, R.G. Cooks, Z. Ouyang, Angew. Chem. Int. Ed. 49 (2010) 877.
[135] I. Marchi, V. Viette, F. Badoud, M. Fathi, M. Saugy, S. Rudaz, J.L. Veuthey, J.
[164] V.S. Pagnotti, E.D. Inutan, D.D. Marshall, C.N. McEwen, S. Trimpin, Anal. Chem.
Chromatogr. A 1217 (2010) 4071.
83 (2011) 7591.
[136] D. Remane, M.R. Meyer, D.K. Wissenbach, H.H. Maurer, Rapid Commun. Mass
[165] M.P. Greving, G.J. Patti, G. Siuzdak, Anal. Chem. 83 (2011) 2.
Spectrom. 24 (2010) 3103.
[166] R.M.A. Heeren, D.F. Smith, J. Stauber, B. Kukrer-Kaletas, L. MacAleese, J. Am.
[137] H. Henry, H.R. Sobhi, O. Scheibner, M. Bromirski, S.B. Nimkar, B. Rochat, Rapid
Soc. Mass Spectrom. 20 (2009) 1006.
Commun. Mass Spectrom. 26 (2012) 499.
[167] J. Pól, M. Strohalm, V. Havlíˇcek, M. Voln ´y, Histochem. Cell Biol. 134 (2010)
[138] R. Pinhancos, S. Maass, D.M. Ramanathan, J. Mass Spectrom. 46 (2011) 1175.
[139] G. Hopfgartner, D. Tonoli, E. Varesio, Anal. Bioanal. Chem. 402 (2012) 2587.
[168] M. Setou, N. Kurabe, J. Electron Microsc. 60 (2011) 47.
[140] J.J. Corr, P. Kovarik, B.B. Schneider, J. Hendrikse, A. Loboda, T.R. Covey, J. Am.
[169] E.R.A. van Hove, D.F. Smith, R.M.A. Heeren, J. Chromatogr. A 1217 (2010) 3946.
Soc. Mass Spectrom. 17 (2006) 1129.
[170] K. Schwamborn, R.M. Caprioli, Mol. Oncol. 4 (2010) 529.
[141] R.J.W. Meestersy, E. den Boer, R.A.A. Mathot, R. de Jonge, R.J. van Klaveren, J.
[171] D. Touboul, O. Laprevote, A. Brunelle, Curr. Opin. Chem. Biol. 15 (2011)
Lindemans, T.M. Luider, Bioanalysis 3 (2011) 1369.
[142] A. Lesur, E. Varesio, G. Hopfgartner, Anal. Chem. 82 (2010) 5227.
[172] S. Guenther, M. Koestler, O. Schulz, B. Spengler, Int. J. Mass Spectrom. 294
[143] D.A. Volmer, L. Sleno, K. Bateman, C. Sturino, R. Oballa, T. Mauriala, J. Corr,
Anal. Chem. 79 (2007) 9000.
[173] J.S. Fletcher, N.P. Lockyer, J.C. Vickerman, Mass Spectrom. Rev. 30 (2011) 142.
[144] D. Vuckovic, X. Zhang, E. Cudjoe, J. Pawliszyn, J. Chromatogr. A 1217 (2010)
[174] J.S. Fletcher, J.C. Vickerman, N. Winograd, Curr. Opin. Chem. Biol. 15 (2011)
[145] S.P. Gygi, B. Rist, S.A. Gerber, F. Turecek, M.H. Gelb, R. Aebersold, Nat. Bio-
[175] K.A.Z. Berry, J.A. Hankin, R.M. Barkley, J.M. Spraggins, R.M. Caprioli, R.C. Mur-
technol. 17 (1999) 994.
phy, Chem. Rev. 111 (2011) 6491.
[146] K. Kristjansdottir, S.J. Kron, Curr. Proteomics 7 (2010) 144.
[176] D. Touboul, A. Brunelle, O. Laprevote, Biochimie 93 (2011) 113.
[147] R.L. Gant-Branum, T.J. Kerr, J.A. McLean, Analyst 134 (2009) 1525.
[177] V. Vidová, P. Novák, M. Strohalm, J. Pól, V. Havlíˇcek, M. Voln ´y, Anal. Chem. 82
[148] M. Lísa, F. Lynen, M. Holˇcapek, P. Sandra, J. Chromatogr. A 1176 (2007) 135.
(2010) 4994.
[149] M. Holˇcapek, M. Lísa, P. Jandera, N. Kabátová, J. Sep. Sci. 28 (2005) 1315.
[178] A. Svatoˇs, Trends Biotechnol. 28 (2010) 425.
[150] E. Cífková, M. Holˇcapek, M. Lísa, M. Ovˇcaˇcíková, A. Lyˇcka, F. Lynen, P. Sandra,
[179] M.L. Reyzer, R.M. Caprioli, Curr. Opin. Chem. Biol. 11 (2007) 29.
Anal. Chem., submitted for publication.
[180] A. Römpp, S. Guenther, Y. Schober, O. Schulz, Z. Takáts, W. Kummer, B. Spen-
[151] M. Mann, Nat. Rev. Mol. Cell Biol. 7 (2006) 952.
gler, Angew. Chem. Int. Ed. 49 (2010) 3834.
[152] Z. Takáts, J.M. Wiseman, B. Gologan, R.G. Cooks, Science 306 (2004) 471.
[181] J. Balog, T. Szaniszlo, K.C. Schaefer, J. Denes, A. Lopata, L. Godorhazy, D. Szalay,
[153] G.A. Harris, A.S. Galhena, F.M. Fernandez, Anal. Chem. 83 (2011) 4508.
L. Balogh, L. Sasi-Szabo, M. Toth, Z. Takáts, Anal. Chem. 82 (2010) 7343.
[154] D.J. Weston, Analyst 135 (2010) 661.
[182] F. Rasche, K. Scheubert, F. Hufsky, T. Zichner, M. Kai, A. Svatoˇs, S. Böcker, Anal.
[155] A. Venter, M. Nefliu, R.G. Cooks, Trends Anal. Chem. 27 (2008) 284.
Chem. 84 (2012) 3417.
[156] Z. Takáts, J.M. Wiseman, R.G. Cooks, J. Mass Spectrom. 40 (2005) 1261.
[183] A. Makarov, Anal. Chem. 72 (2000) 1156.
[157] Z. Takáts, I. Cotte-Rodriguez, N. Talaty, H.W. Chen, R.G. Cooks, Chem. Commun.
(2005) 1950.
Source: http://ftp.ch.bme.hu/oktatas/konyvek/anal/MSc-Elvalasztastechnika/MSc-2012-2013/MS%20stateof%20the%20art.pdf
Comparison of the antibacterial activities of different brands of Ciprofloxacin Comparación de la actividad antibacterial de diferentes marcas de Ciprofloxacina Muhammad Shahid NAZIR MUGHAL , Muhammad Tahir ASGHAR, Muhammad Atif ZIA and Tariq ISMAIL Pharmaceutical Lab, Punjab Institute of Paramedical Studies. 13 Mamdot Block Mustafa Town Lahore Pakistan.
Kermack et al. BMC Women's Health 2014, 14:130http://www.biomedcentral.com/1472-6874/14/130 A randomised controlled trial of apreconceptional dietary intervention in womenundergoing IVF treatment (PREPARE trial) Alexandra J Kermack1,2,3*, Philip C Calder1,3, Franchesca D Houghton1, Keith M Godfrey1,3,4and Nicholas S Macklon1,2,3 Background: In vitro fertilisation (IVF) treatment provides an opportunity to study early developmental responsesto periconceptional dietary interventions. Retrospective studies have suggested links between preconception dietand fertility, and more recently, a "Mediterranean" diet has been reported to increase pregnancy rates by up to40%. In addition, a prospective study examining increased intake of omega-3 polyunsaturated fats demonstrated aquickened rate of embryo development after IVF. However, up to now, few prospective randomised controlled trialshave investigated the impact of periconceptional dietary interventions on fertility outcomes.