Microsoft word - rt-05.doc
International Conference on Mechanical, Industrial and Materials Engineering 2013 (ICMIME2013)
1-3 November, 2013, RUET, Rajshahi, Bangladesh.
Paper ID: RT-05
Analyzing Energy Drinks Effect on Respiratory and Cardiac Function by
Wavelet Transforms Using Laser Doppler Flowmetry
Md. Nafiur Rahman Protik1, Fatema Khatun2, Muhammad Muinul Islam3
1,2Dept. of Telecommunication and Electronic Engineering, Hajee Mohammad Danesh Science and
Technology University, Dinajpur, Bangladesh
3Dept. of Biomedical Engineering, Khulna University of Engineering and Technology, Khulna-9203,
E-mail: [email protected], [email protected], [email protected]
Abstract
Wavelet transform was used to analyze the effect of having energy drinks (ED) on respiratory and cardiac
functions. Laser Doppler Flowmetry technique LDF100C (Biopac systems Inc.) was used on 12 healthy human
subjects to analyze the effect of having energy drinks. After having energy drinks, by spectral analysis of LDF
signal, it is observed that the amplitude of blood perfusion signal was increased. The physiological activities
which include the frequency interval studied from 0.0095- 1.6 Hz was divided into five subintervals. Among
them respiratory function due to 0.15-0.4 Hz and cardiac function due to 0.4-1.6 Hz, was measured in BPU2/Hz
before and after having energy drinks. Discrete Wavelet transform was used for further analyzing frequency
spectrum of the blood perfusion signal. A significant change was observed in these activities after having energy
drinks. The amplitude of frequency spectrum of LDF signal related to respiratory activity increases around two
fold. A little change was observed in cardiac function.
Keywords: AcqKnowledge software, Blood perfusion signal, Energy drinks, Laser Doppler Flowmetry, Wavelet
analysis.
1. Introduction
The laser Doppler flow signal from the skin generally contains constant and oscillatory components. Cyclical
flow variations have different periods (and frequencies), according to their origins. Spectral analysis has been
used to identify six frequency bands, around 0.009 Hz, 0.01 Hz, 0.04 Hz, 0.1 Hz, 0.3 Hz and 1 Hz. Among
them 0.3 Hz and 1 Hz, whose origins are known as respiratory and cardiac, respectively [1]. In addition, the
cardiac and respiratory rhythms have been detected in the regions around 1 and 0.3 Hz in human skin [2]-[6].
Today energy drinks become the latest craze and a permanent fixture in our culture. An energy drink is a
beverage that contains some form of legal stimulant and/or vitamins which are supposed to give consumers a
short term boost in energy. Make a mental note that while the Food and Drug Administration (FDA) is allowing
companies to sell and market their energy drink products, there is still very little research that has been done on
them. It is suspected that the FDA allows them to be added simply because they do not pose any immediate
danger to energy drink consumers [7].
The aim of the study is to determine the microvascular changes in the periodic oscillations of cutaneous blood
perfusion after having energy drinks using Laser Doppler Flowmetry Technique. We hypothesized that having
energy drinks changes in microvascular control mechanisms of the skin would result in differences in the
spectral components and their corresponding amplitudes.
2. Materials and Method
Laser Doppler Flowmetry
The LDF technique takes advantage of the Doppler Effect, which is seen as a frequency shift in coherent monochromatic light waves scattered from moving red blood cells (erythrocytes) in the blood [7]. A LDF device uses two laser probes, one is the light-emitting probe and the other is the receiving probe [8]. The principle of laser Doppler Flowmetry technique is shown in Fig. 1, where low power laser light is used to illuminate tissue using a fiber optic; the light is scattered by the static tissue structures and moving blood cells; the moving blood cell impart a Doppler Shift; an adjacent fiber detects light returned from the tissue; this light contains Doppler shifted and unshifted light; the signal is processed to extract the signal related to the moving red blood cells [9].
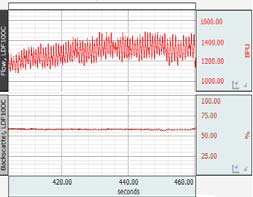
Fig. 1. Schematic of LDF
Subjects
Twelve healthy male subjects (between 24 and 32 years old) were enrolled and their Mean ±SD (range) for age (23.33±2.87yrs), weight (63.67±10.61kgs), height (165.89±8.03cms) and Body Mass Index (BMI) (22.27±3.30 kg/m2) were taken where value (N=12)a. No medications were taken during the week prior to the study. The study was approved by the local Ethics Committee.
a.Values are Mean ±SD.
Energy Drinks
In this experiment we have used drinks of serving size of 250ml/can which contains caffeine 62.5mg/250ml of, 27 gm sugar per 250ml can and other ingredients e.g. water, acidity regulators: citric acid and sodium citrate, carbon dioxide, taurine (0.4%), flavor, inositol (0.02%), colours: E 150d, riboflavin, enriching substances: vitamins (niacin, panthotenic acid, vitamin B6, vitamin B12).
Experimental Setup & Testing Procedure
The subjects were resting in the supine position throughout the whole experimental period. A quiet room with
the temperature kept at 22°C (21-23) was used for this study as well as for LDF measurements. MP150 (Biopac,
USA) data acquisition unit was used in combination with universal interface module, UIM 100C (Biopac,
USA). LDF measurements were performed with the Laser Doppler Flowmetry module, LDF100C (Biopac,
USA).
3. Result and Discussion
Recording of LDF Signal
A typical laser Doppler Flowmetry recording of human forearm on middle finger tip at normal condition is
shown in Fig. 2(a) for 60 seconds which oscillate around 1100 BPU (arbitrary unit).
Fig. 2. Laser Doppler Flowmetry recording of human forearm on middle finger tip (a) normal condition (b)
After having Energy drinks
Fig. 2(b) shows the LDF recording at the same position after having energy drinks. From Fig. 2(b) it is seen that the amplitude of LDF perfusion signal has been increased after consumption of energy drinks showing an increased level of oscillation of which peak touches 1500 BPU.
Wavelet Analysis of LDF Signal
The popularity of Wavelet Transform is growing because of its ability to reduce distortion in the reconstructed signal while retaining all the significant features present in the signal. The average scalogram is displaying information at frequency range, i.e., 0.15-1.6 Hz covering the respiratory and heart activities, compared with a standard PSD model. DWT which is based on sub-band coding is found to yield a fast computation of Wavelet Transform [10]. Wavelet type selected as Biorthogonal 4.4 with iterations 1 to specify the number of transforms to execute iteratively [10]. After DWT, resampling the graph and smoothing are the two processes were also done in both condition. After doing all the three processes in both condition final average scalogram was found this is shown in Fig. 3. Table 1 shows the peak values difference in the respective frequency band before and
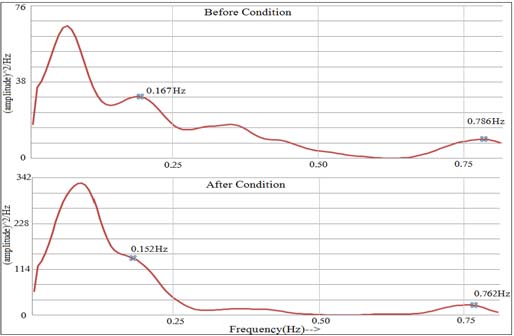
after having energy drinks. At the interval of respiratory activity peak value is 2.83 BPU at 0.167 Hz at before whereas 5.08 BPU at 0.152 Hz at after. This says that respiratory activity increases around two fold. Also it shows that heart activity increases around a little i.e., 10.64 BPU to 12.68 BPU.
Fig. 3. Average scalogram of before and after having energy drinks
Table 1. Typical Changes in Amplitude Spectrum of LDF signal from 0.15 to 1.6 Hz
Frequency
Origin of
Peak Spectral amplitude
Range(Hz)
Oscillation
Before Having After Having
Energy Drinks
Energy Drinks
p
0.15-0.4 Respiratory
10.64 0.762 12.18
b. Frequency of peak spectral amplitude
Statistical Analysis
The differences that can be found in average scalograms of Fig. 3 will be discussed by statistical analysis. For statistical analysis p-value measurements are done here.
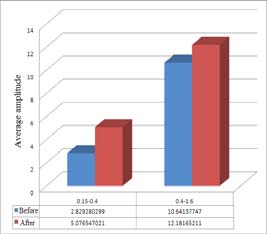
• Peak spectral amplitude: The peak of the respiratory activity is detected at 0.167 Hz for the normal and at 0.152 Hz for the condition of after having energy drinks. Heart activity is detected at 0.786 Hz at normal and 0.762 Hz at after having drink condition. Respiratory and heart function also have the differences which are statistically significant. • Average amplitude: We know the greater the amplitude of the wave, the more energy. The amplitude averaged over the whole frequency band of our interest is significantly higher for after having drink than for normal conditions [see Fig. 4(a)]. Furthermore, the energy is larger within each of the two observed frequency bands [see Fig. 4(b)].
Fig. 4. The (a) average amplitude (b) average amplitude with energy- over each frequency band (Respiratory and Heart).
4. Conclusion
In peripheral blood flow signals, measured by Laser Doppler Flowmetry, oscillations on markedly different time
scales are present. To analyze them, the wavelet transform was applied. It is observed that respiratory rate
increases around two fold which conclude that the energy drinks have relatively effect of respiration system.
Whether a little change is occurred in heart function that reflects an increased stroke volume in response to
consuming energy drinks.
5. Acknowledgement
Authors wish to thank all participants in this study and cordially grateful to the Department of Biomedical
Engineering, Khulna University of Engineering & Technology, Khulna, where the measurements were done.
6. References
M. Bracic and A. Stefanovska, "Wavelet based analysis of human blood flow dynamics," Bulletin of Mathematical Biology, vol. 60, pp. 417-433, 1998.
Stefanovska, "Self-organization of biological systems influenced by electrical current," Thesis, Faculty of Electrical Engineering, University of Ljubljana, Slovenia, 1992.
Stefanovska, "Self-organization of biological systems influenced by electrical current," Thesis, Faculty of Electrical Engineering, University of Ljubljana, Slovenia, 1992.
Bollinger, A. Yanar, U. Hoffmann and U. K. Franzeck, "Is high-frequency fluxmotion due to respiration or to vasomotion activity?" Progress in Applied Microcirculation, Karger Basel, 1993, pp. 52-58.
[5] Kvandal, P., Landsverk, S.A., Bernjak, A., Stefanovska, A.,
Kvernmo, H.D., Kirkeboen, K.A., "Low-frequency oscillations of the laser Doppler perfusion signal in human skin", Microv. Res. 72 (3), 120-127 (2006).
[6] Brian, 2004, November 23rd, "Energy Drinks: Ingredients &
Dangers", Citynet Magazine. http://www.citynetmagazine.com/nightlife/energy-drinks.html
Robert B. Northrop. Noninvasive Instrumentation and Measurement in Medical Diagnosis. CRC Press, 2002.
M. F. Swiontkowski, "Laser Doppler Flowmetry—Development and Clinical Application," Iowa Orthopaedic Journal, vol. 11, pp. 119-126, 1991.
Biopac Blood flow Monitor, Biopac Systems, Inc. ISO 9001:2000, http://www.biopac.com/Manuals/laser-doppler-flow.pdf
[10] Data Acquisition and Analysis with BIOPAC MP Systems,
AcqKnowledge 4 Software Guide.pdf, Biopac Systems, Inc. ISO 9001:2008, http://www.biopac.com/LabManuals.asp
Source: http://icmime-ruet.ac.bd/2013/Contents/Technical%20Papers/Related%20Technology/RT-05.pdf
Vestnik zoologii, 38(5): 57–66, 2004© I. A. Akimov, S. V. Benedyk, L. M. Zaloznaya, 2004 COMPLEX ANALYSIS OF MORPHOLOGICALCHARACTERS OF GAMASID MITEVARROA DESTRUCTOR (PARASITIFORMES, VARROIDAE) I. A. Akimov, S. V. Benedyk, L. M. Zaloznaya Schmalhausen Institute of Zoology NAS Ukraine,vul. B. Khmelnits'kogo, 15, Kyiv, 01601 Ukraine Accepted 23 October 2003 Complex Analysis of Morphological Characters of Gamasid Mite Varroa destructor (Parasitiformes, Var-roidae). Akimov I. A., Benedyk S. V., Zaloznaya L. M. — The study of seasonal variability of miteV. destructor was carried out. The summer generation of mites appears to be characterized by the largestmorphological variability whereas the winter one has stable characters. We failed to evolve the complexof morphological characters that would allow us to identify, with high level of reliability, certainphenotype of the mite. Significant stability of morphological characters of V. destructor in the course oftime was determined. The mean values of the length and width of the body allow to consider theUkrainian population of Varroa mite, which parasitize the honey bee Apis mellifera Linnaeus, as theKorean haplotype of Varroa destructor Anderson et Trueman, 2000.
The Internet Journal of Anesthesiology Volume 29 Number 1 A Comparative Study Of Ondansetron And Granisetron ForPrevention Of Nausea And Vomiting FollowingLaparoscopic SurgeriesA Chidambaram, K Bylappa, P Somasekaram A Chidambaram, K Bylappa, P Somasekaram. A Comparative Study Of Ondansetron And Granisetron For Prevention OfNausea And Vomiting Following Laparoscopic Surgeries. The Internet Journal of Anesthesiology. 2010 Volume 29 Number1.