Microsoft word - manoshi evaluation surveys report_final
COMMUNITY HEALTH SOLUTIONS IN
BANGLADESH
Impact Evaluation Surveys in Dhaka Urban
Slums 2007, 2009 and 2011
Scientific Report No: 118
December 2011
COMMUNITY HEALTH SOLUTIONS IN
BANGLADESH
Impact Evaluation Surveys in Dhaka Urban
Slums 2007, 2009 and 2011
Nurul Alam
Dilruba Begum
Syed Masud Ahmed
Peter Kim Streatfield
International Centre for Diarrhoeal Disease Research, Bangladesh (icddr,b) and BRAC
in cooperation with
Bill & Melinda Gates Foundation
ISBN: 978-984-551-329-6
Scientific Report No. 118
December 2011
Published by
International Centre for Diarrhoeal Diseases Research, Bangladesh (icddr,b)
GPO Box 128, Dhaka 1000
Mohakhali, Dhaka 1212, Bangladesh
Telephone: 8860523-32 (10 lines); Fax: (880-2)-8826050
Email:
[email protected] URL: http://www.icddrb.org
Printed by: Impression Printing House
This research activity was funded by the Bill & Melinda Gates Foundation, USA and BRAC, Bangladesh. icddr,b acknowledges with gratitude the commitment of the Bill & Melinda Gates Foundation and BRAC to its research efforts.
The MANOSHI project is developed by BRAC to establish a community-based health programme targeted at reducing maternal, neonatal, and child deaths and diseases in urban slums of Bangladesh. It is supported by the Bill and Melinda Gates Foundation's Community Health Solutions (CHS) initiative that aims at strengthening and leveraging community organizations and individuals to be proactive in community based interventions. This five-year project is led and implemented by BRAC. icddr,b, in collaboration with the Research and Evaluation Division (RED) of BRAC provide technical assistance to the project through monitoring, evaluation and research support. This project is guided by a Technical Advisory Committee and a Technical Management Committee.
BRAC and icddr,b would like to acknowledge the Bill and Melinda Gates Foundation for their continued support. We are grateful to all the researchers and members of programme team for their unabated diligence and efforts. We want to extend our appreciation to all the respondents from the various communities for their wilful contributions and sincere commitment towards fulfilling this research endeavour. We also acknowledge the contributions of ACPR (Associates for Community and Population Research) for field data collection.
Technical Advisory Committee
Technical Management Committee
Dr. Abhay Bang
Dr. Abbas Bhuiya
Deputy Executive Director
Executive Director's Division
icddr,b, Bangladesh
Dr. Lynn Freedman
Dr. Peter Kim Streatfield
Director, Centre for Population Urbanization and
Averting Maternal Death and Disability (AVDD)
Columbia University, USA
Health and Demographic Surveillance Unit icddr,b, Bangladesh
Dr. Jon Rohde
Dr. Shams El Arifeen
Director, Centre for Child and Adolescent Health
International Advisory Board
icddr,b, Bangladesh
James P. Grant School of Public Health
BRAC, Bangladesh
Ms. Julienne Hayes Smith
Mr. Faruque Ahmed
Safe Motherhood Project
Health Programme
CARITAS CH-NFP, Bangladesh
BRAC, Bangladesh
Dr. Abbas Bhuiya
Dr. Kaosar Afsana
Deputy Executive Director
Associate Director
Office of the Deputy Executive Director
Health Programme
icddr,b, Bangladesh
BRAC, Bangladesh
Prof. Sameena Chowdhury
Dr. Syed Masud Ahmed
Professor and Head of Department
Research Coordinator
Obstetrics and Gynaecology Institute of Child and
Research and Evaluation Division
Mother Health, Bangladesh
BRAC, Bangladesh
Prof. Mohammod Shahidullah
Dr. Hashima-e-Nasreen
Pro-Vice Chancellor (Admin.) and Chairman
Senior Research Fellow
Dept. of Neonatology
Research and Evaluation Division
BSMMU, Bangladesh
BRAC, Bangladesh
Dr. Zafrullah Chowdhury
Dr. Jahangir Khan
Health Economist
Gono Shasthaya Kendra
Director's office of CEHS
icddr,b, Bangladesh
Dr. Kaosar Afsana
Dr. Laura Reichenbach
Associate Director
Director, Centre for Reproductive Health
icddr,b, Bangladesh
BRAC, Bangladesh
Dr. Alayne Adams
Senior Social Scientist Director's office of CEHS icddr,b, Bangladesh
Abbreviations and Acronyms
ACPR
Associates for Community and Population Research
Acute respiratory infection
Assistance for Social Advancement
Behaviour change communication
Bangladesh Demographic and Health Survey
Bangladesh Rural Advancement Committee
Community-based skilled birth attendants
Dhaka Metropolitan Area
Exclusive breast feeding
Expanded Programme on Immunization
International Centre for Diarrheal Disease Research, Bangladesh
Medical Assistant
Maternal, newborn and child care
NGO Non-governmental
National Institute of Population Research and Training
Poverty reduction strategy paper
Primary sampling unit
SACMO Sub-Assistant
Urban Primary Health Care
Urban Primary Health Care Project II
Vitamin A deficiency
World Health Organization
CONTENTS
SUMMARY OF FINDINGS . i Map of Dhaka City Corporation . ix CHAPTER 1: INTRODUCTION 1.1 Health Services Delivery for Urban Poor . 1 1.2 Launching of the Manoshi Project . 2 1.3 Slums under Dhaka Metropolitan Area . 3 1.4 Methodology of Manoshi Impact Evaluation Surveys . 4 1.5 Organization of the Manoshi Impact Evaluation Surveys . 4
1.5.1 Survey Objectives and Implementation Organization . 4 1.5.2 Sampling Design of the Surveys . 5 1.5.3 Survey Questionnaire . 6
CHAPTER 2: HOUSEHOLD POPULATION AND HOUSING CHARACTERISTICS 2.1 Household Population by Age and Sex . 7 2.2 Educational Attainment . 9 2.3 Household Characteristics . 10 2.4 Household Possessions of Durable Assets . 12 2.5 Socioeconomic Status and Wealth Index . 12 CHAPTER 3: CHARACTERISTICS OF SURVEY WOMEN 3.1 Background Characteristics of Women . 15 3.2 NGO Involvement . 16 3.3 Income/Employment Activities . 17 3.4 Migration History. 18 3.5 Reproduction . 19 CHAPTER 4: KNOWLEDGER OF MATERNAL COMPLICATIONS AND NEWBORN CARE 4.1 Women's Knowledge about Maternal Health Services . 21 4.2 Mother's Knowledge on Newborn and Childcare . 25 4.3 Pregnancy Planning . 30 CHAPTER 5: PRACTICES RELATING TO MATERNAL AND NEWBORN'S HEALTH 5.1 Maternity care and services received . 32 5.2 Pregnancy Complications and Management . 54 5.3 Immediate Newborn Care . 57 CHAPTER 6: CHILD HEALTH IMMUNIZATION, MORBIDITY, AND MANAGEMENT 6.1 Immunization . 61 6.2 Children's Morbidity and Management . 62 CHAPTER 7: PERCEPTION ON DELIVERY FACILITIES AND BRAC'S BIRTHING HUT 7.1 Opinion on Local Healthcare Facilities . 65 7.2 Awareness about BRAC's Birthing Hut . 66
CHAPTER 8: POLICY IMPLICATIONS OF THE MANOSHI'S PROJECT IMPACT EVALUATION SURVEYS AND CONCLUSIONS 8.1 Status of Maternal and Child Health in Dhaka Urban Slums . 68 8.2 Policy Implications of Manoshi Impact Evaluation Surveys in 2007, 2009, and 2011 . 68 8.3 Conclusion . 71
List of Tables
Table 1
Sample-size of the baseline, midline and end line surveys for estimating
maternal, newborn and childcare indicators
Table 2.1.1a Percent distribution of the
de jure household population by age, sex and
area in Dhaka urban slums, 2007, 2009, and 2011
Table 2.1.1b Distribution of the sex ratio (= ×100) by age and area in Dhaka urban
slums, 2007, 2009, and 2011
Percent distribution of household by sex of household head, household-size 9 in Dhaka urban slums, 2007, 2009, and 2011
Percent distribution of household population aged 5 years or older by
education in Dhaka urban slums, 2007, 2009, and 2011
Percent distribution of households by housing quality in Dhaka urban
slums, 2007, 2009, and 2011
Percent distribution of households by durable assets in Dhaka urban slums,
2007, 2009, and 2011
Mean and factor loadings of standardized variables used for constructing
asset score in Dhaka urban slums, 2007, 2009, and 2011
Percent distribution of women by household asset quintiles by area in
Dhaka urban slums, 2007, 2009, and 2011
Percent distribution of women by socio-demographic characteristics in
Dhaka urban slums, 2007, 2009, and 2011
Percent distribution of women by NGO involvement and membership in
Dhaka urban slums, 2007, 2009, and 2011
Percent distribution of women by employment characteristics in Dhaka
urban slums, 2007, 2009, and 2011
Percent distribution of women by residence status and migration history in
Dhaka urban slums, 2007, 2009, and 2011
Percent distribution of women by number of children ever born and number 20 of children currently living in Dhaka urban slums, 2007, 2009, and 2011
Percent distribution of women by pregnancy terminations and place of treatment 20
for pregnancy terminations in Dhaka urban slums, 2007, 2009, and 2011
Percent distribution of women by knowledge about services required during 21 pregnancy in Dhaka urban slums, 2007, 2009 and 2011
Percent distribution of women by knowledge about services required after
delivery in Dhaka urban slums, 2007, 2009, and 2011
Percent distribution of women by knowledge about complications during
pregnancy, place for treatment and sources of information in Dhaka urban slums, 2007, 2009, and 2011
Percent distribution of women by knowledge about complications during
and after delivery in Dhaka urban slums, 2007, 2009, and 2011
Percent distribution of mothers by knowledge about life-threatening health
problems of newborns during the first week after birth and place for treatment in Dhaka urban slums, 2007, 2009, and 2011
Percent distribution of mothers by essential newborn and childcare practices 27 known to them in Dhaka urban slums, 2007, 2009, and 2011
Percent distribution of mothers by knowledge about newborn and child-
feeding practices in Dhaka urban slums, 2007, 2009, and 2011
Percent distribution of mothers by knowledge about children's morbidity
and management practices in Dhaka urban slums, 2007, 2009, and 2011
Percent distribution of women by pregnancy planning prior to
pregnancy/childbirth in Dhaka urban slums , 2007, 2009, and 2011
Percent distribution of women who had live births in the last one year by
any ANC visit for the most recent pregnancy and residence status in Dhaka urban slums, 2007, 2009, and 2011
Percent distribution of women with live births in the last one year by
number, timing and place of ANC visit for the most recent pregnancy in Dhaka urban slums, 2007, 2009, and 2011
Percent distribution of women who gave live births in the last one year and
had 4+ ANC visits for the most recent pregnancy by parity, education, and household asset quintile in Dhaka urban slums, 2007, 2009, and 2011
Table 5.1.4: Demographic and socioeconomic variables associated with women's 4+
ANC visits for the most recent pregnancy in the last one year in Dhaka urban slums, 2007, 2009, and 2011
Percent distribution of women who gave live births in the last one year by
services and messages received during ANC visits for most recent pregnancy in Dhaka urban slums, 2007, 2009, and 2011
Percent distribution of women by residence status and place of delivery
with live births in the last one year in Dhaka urban slums, 2007, 2009, and 2011
Percent distribution of women who had institutional delivery with live
births in the last one year by parity, level of education, and asset score in Dhaka urban slums, 2007, 2009, and 2011
Demographic and socioeconomic variables associated with women's
institutional delivery with live births in the last one year in Dhaka urban slums, 2007, 2009, and 2011
Percent distribution of women by assistance, mode and procedure of
delivery with live births in the last one year in Dhaka urban slums, 2007, 2009, and 2011
Table 5.1.10 Percent distribution of women who had cesarean-section delivery with live
birth in the last one year by duration of residence, parity, level of education, and asset quintile in Dhaka urban slums, 2007, 2009, and 2011
Table 5.1.11 Demographic and socioeconomic variables associated with women's C-
section delivery with live births in the last one year in Dhaka urban slums, 2007, 2009, and 2011
Table 5.1.12 Percentage of normal and C-section deliveries by place of delivery with live 45
births in the last one year in Dhaka urban slums, 2007, 2009, and 2011
Table 5.1.13 Percent distribution of deliveries with live births in the last one year without
out-pocket expenditure by mode of delivery in Dhaka urban slums, 2007,
Table 5.1.14 Mean and median of the out-of-pocket expenditure by mode of delivery
with live birth in the last one year in Dhaka urban slums, 2007, 2009, and 2011
Table 5.1.15 Average of out-of-pocket expenditure by institutional delivery with live
births in the last one year in Dhaka urban slums, 2007, 2009, and 2011
Table 5.1.16 Percent distribution of women by source of out-of-pocket expenditure and
mode and place of delivery with live births in the last one year in Dhaka urban slums, 2007, 2009, and 2011
Table 5.1.17 Percent distribution of women who had PNC visits with live births in the
last one year in Dhaka urban slums, 2007, 2009, and 2011
Table 5.1.18 Percent distribution of women by PNC visit with live births in the last one
year in Dhaka urban slums, 2007, 2009, and 2011
Table 5.1.19 Demographic and socioeconomic variables associated with women's PNC
for the most recent birth in Dhaka urban slums, 2007, 2009, and 2011
Table 5.1.20 Demographic and socioeconomic variables associated with women's 4+
ANC visits, institutional delivery, and PNC visit for most recent birth in Dhaka urban slums, 2007, 2009, and 2011
Percent distribution of women by complication and its management during
pregnancy with live births in the last one year in Dhaka urban slums, 2007, 2009, and 2011
Percent distribution of women who gave a live birth in the last one year by
use of Misoprostol and place of delivery in Dhaka urban slums in 2011
Percent distribution of neonates born in the last one year by initial feeding
and other care in Dhaka urban slums, 2007, 2009, and 2011
Percent distribution of neonates born in the last one year by complications
and their management in Dhaka urban slums, 2007, 2009, and 2011
Percent distribution of children aged 1-4 year(s) by vaccines received at
anytime before the survey in Dhaka urban slums, 2007, 2009, and 2011.
Percent distribution of children aged 1-4 year(s) by prevalence of common
childhood illnesses in the last two weeks in Dhaka urban slums, 2007, 2009, and 2011
Percent distribution of children aged 1-4 year(s) sick with diarrhoea in the
last two weeks by management and features of diarrhoea in Dhaka urban slums, 2007, 2009, and 2011
Percent distribution of women by their opinion on availability of health
services in the locality in Dhaka urban slums, 2007, 2009, and 2011
Percent distribution of women who had a child in the last five years by
knowledge and usage of BRAC's birthing hut in Dhaka urban slums, 2007, 2009, and 2011
SUMMARY OF FINDINGS
BRAC has launched the Manoshi project in 2007 for implementing a community-based
programme on comprehensive package of essential services in urban slums for improvement
of maternal, newborn and child health. The package included capacity development of the
community health workers and birth attendants; development of health services provisions
for pregnant and lactating women, neonates and under-five children; timely referral to quality
health facilities; community empowerment through development of women's groups; and
linkage with government (national and local), community people, and NGOs. The community
health workers and birth attendants have received training to offer antenatal, safe delivery and
postnatal care, neonatal care and childcare. The project has expanded its activities in two
phases and covered all slums in Dhaka metropolitan area (DMA) by 2009.
As part of the impact evaluation activities of the Manoshi project, three community-based
cross-sectional surveys (baseline, midline, and endline) are conducted in Dhaka urban slums
in 2007, 2009, and 2011. A two-stage random cluster-sampling was used for selecting 100
slum-clusters (50 each from the project and the comparison areas in baseline survey and 67
from the project area and 33 from the comparison area in the midline and the endline
surveys). The sample-size in the baseline survey was 2,874 [(1,284 women having infants
and 1,590 having children aged 1-4 year(s)]; the sample-size in the midline was 3608 [(1,549
women having infants and 2,049 having children aged 1-4 year(s)]; and that the endline
survey was 3,226 [(1,549 women having infants and 1,677 having children aged 1-4 year(s)].
Each survey obtained data from two groups of respondents in the project and the comparison
areas.
The baseline survey randomly selected comparison clusters around the project slums while
the midline and the endline surveys selected comparison clusters from a few non-project
slums (in Nikunja housing area, Dhaka Uddyan, and Baraid) in Dhaka city and from slum-
like clusters of impoverished households in the periphery of Dhaka city (namely Demra,
Jingira, Keranigonj, and Tongi). As such, the comparison groups of the midline and endline
surveys are not truly comparable with the project groups but provided contemporary
estimates of knowledge and practices in maternity and newborn care for women in low-
income urban households. The results of the three cross-sectional surveys conducted in 2007,
2009, and 2011 are presented below to assess changes in knowledge and practices within and
between areas over the years. Consistent difference in maternal and newborn healthcare
indicators between 2007 and 2011 in the project area compared to the comparison area could
be attributed largely to the effects of the Manoshi's project activities.
Household Population and Housing Characteristics
The sampled household populations are predominantly young, with 41-46% aged below 15 years and 45-51% aged 15-44 years in three surveys. Average household size has decreased in either area over the years. The average is 4.8 persons each in the project and the comparison areas in 2007 compared to 4.7 and 4.6 persons respectively in 2011. The percentage of the female headed households has shown a declining trend: 7% each in the project and the comparison areas in 2007 decreased to 5% each in 2011.
Impact Evaluation Surveys in Dhaka Urban Slums 2007, 2009 and 2011 i
Literacy rate (among persons aged 5+ years) was higher in 2011 compared to 2007 in the
project area only. It was, however, similar in the comparison area.
Characteristics of the Sampled Households
Almost all (99%) of the households had electricity connections in 2011 compared to 89% in
2007 in the project area. In the comparison area, the figures were 95% in 2007 and 96% in
2011.
Access to sanitation (measured in terms of possession of modern toilet or water-sealed
latrine) has increased to 73% in 2011 from 33% in 2007 in the project area. In the comparison
area, it increased to 68% in 2011 from 59% in 2007.
More households had piped water inside dwelling houses in 2011 compared to 2007 in the
project area (65% versus 56%) and the comparison area (75 versus 65%).
Proportionately, more households had roofs, walls, and floors made of cement/concrete in
2011 than in 2009 and 2007 in both areas.
More households had more durable assets, such as wardrobe, table, chair, television, and
mobile phones (but not watch, radio, bicycle, and rickshaw/van) in 2011 than in 2009 and
2007 in either area, suggesting an improvement in quality of living over the years.
Characteristics of the Sampled Women
Women with complete primary education (class 5 or higher) were higher at 59% in 2011 compared to 34% in 2007 in the project area. In the comparison area, the figure was 48% in 2011 compared to 49% in 2007. Access to mass media (measured in terms of reading newspapers, listening to radio or watching television at least once a week), with prominence of television over newspapers and radio being universal in either area. Women's participation in labour force (indicated by employment at the survey time) decreased from 25% in 2007 to 17% in 2011 in the project area. In the comparison area, participation has decreased from 26% in 2007 to 21% in 2011. Their involvement in NGO activities decreased in the project and the comparison areas over the years (from 23% each in 2007 to 9% and 13% respectively in 2011). More than half of the women in either area came from rural areas, and the share shrank over the years. Mean number of children ever born to the women was lower in the project and the comparison areas in 2011 (2.1 and 2.2, respectively) than in 2007 (2.6 and 2.4 respectively).
Impact Evaluation Surveys in Dhaka Urban Slums 2007, 2009 and 2011 ii
Women's Knowledge about Maternity Care
Knowledge about requirements for antenatal care and TT vaccination during pregnancy was
universal (>97%) in each area and year. Importance of iron supplementation during
pregnancy was known to more than 91% of the women in either area.
Knowledge about government recommendation of 4+ ANC visits increased from 45% in
2007 to 59% in 2011 in the project area. In the comparison area, it increased from 50% in
2007 to 52% in 2011.
Knowledge about requirements of postnatal care (PNC) was high (83% or more) in either
area but awareness of the recommended 3+ PNC visits decreased over the years: from 40%
each in 2007 to 28% each in 2011 in both areas.
Knowledge about requirements of vitamin A intake and iron supplementation after delivery
was as high as 86%. It increased at a higher rate in the project area than in the comparison
area over the years.
Knowledge about life-threatening pregnancy complications/illnesses (except lower
abdominal pain and reduced foetal movement) improved in either area over the years. In
2011, the complications were known to 5-15% more women in the project area than in the
comparison area.
For treating pregnancy complications/illnesses more women opt for government hospitals
(59% and 69% respectively), followed by private clinics (30% and 33% respectively) and the
NGO health centres (18% and 21% respectively) in either area in 2011. BRAC delivery hut is
opted by 30% in 2011 compared to 2% in 2007 in the project area and 3% in the comparison
area in 2011.
Knowledge about life-threatening post-delivery complications increased more in the project
area than in the comparison area over the years.
For managing such complications, more women in either area in 2011 opted for government
hospitals (77% and 80% respectively), followed by private clinics (32% and 34%
respectively) and the NGO health centres (24% and 16% respectively).
Women's Knowledge about Newborn and Child Health Problems
When asked about newborn's life-threatening health problems in 2011, women in the project
area mentioned more frequently: difficult or fast breathing, asphyxia, jaundice, and
convulsions (70%, 49%, 39%, and 37% respectively) as health problems compared to women
in the comparison area (65%, 48%, 27%, and 30% respectively).
For treating these problems, more women in either area in 2011 opted for government
hospitals (78% each), followed by private clinics (42% each) and NGO health centres (16%
and 11% respectively).
Impact Evaluation Surveys in Dhaka Urban Slums 2007, 2009 and 2011 iii
Knowledge relating to drying newborn thoroughly, wrapping with warm clothes, and feeding
colostrums improved faster over the years in the project area than in the comparison area.
Mothers' knowledge about requirements of vaccination right after birth and vitamin A for
under-five children was universal in either area.
Knowledge about newborn's first feeding substantially improved―more in the project area
than in the comparison area over the years.
While knowledge about time of initiation of breastfeeding (within one hour) was almost
universal (>90%) in either area, knowledge of duration of exclusive breastfeeding (up to 6
months) improved more in the project area―from 73% in 2007 to 96% in 2011 than the
comparison area; this improved from 68% in 2007 to 91% in 2011.
Two in every five women knew symptoms of acute respiratory infection (ARI) and did not
improve in either area over the years.
Knowledge of giving packet-saline to children suffering from diarrhoea was universal (95%
or more) but giving ‘more-than-usual food to children with diarrhoea' was known to three in
five women in either area.
For treating diarrhoea and pneumonia in children, the most preferred healthcare provider in
either area in 2011 was qualified doctor (87% in the project area and 83% in the comparison
area).
More women in the project area than in the comparison area in 2011 made pregnancy
planning (91% versus 80%), made plan for assistance during delivery (80% versus 77%
respectively) and saved money to face extra expenses relating to childbirth (77% versus
72%).
Use of Maternal Health Services
The percentage of women having any ANC visit during the last pregnancy as well as average
number of ANC visits increased more in the project area than in the comparison area over the
years
Coverage of government-recommended ‘4 or more ANC visits' increased in the project area
from 27% in 2007 to 42% in 2009 to 52% in 2011 but not in the comparison area (36% in
2007, 34% in 2009, and 36% in 2011).
Coverage of 4 or more ANC visits was higher for births of the first-order than four or higher
order, for women with secondary education than no education; and the least poor than poorest
households in either area. Differentials in ANC coverage by birth-order, education and
economic groups decreased in the project area but not in the comparison area over the years.
Places to get ANC in the project area in 2011 were BRAC birthing (or delivery) hut (35%),
followed by private clinics (17%), and NGO health centres (14%). In the comparison area,
Impact Evaluation Surveys in Dhaka Urban Slums 2007, 2009 and 2011 iv
places included government hospitals (25%), followed by NGO health centres (21%), and private clinics (16%) in 2011. ANC services that the women received were of higher quality in the project area than in the comparison area. Measurements of weight and height and examination of abdomen (67% versus 59%, 11% versus 19% and 70% versus 52% respectively) were more frequent in the project area compared to the comparison area in 2011. During ANC visits in 2011, more women in the project area compared to the comparison area received advice on 'proper diet', ‘taking rest', ‘not to lift heavy items', and ‘intake of iron supplement' during pregnancy (72%, 64%, 49%, and 17% respectively). The percentage of institutional delivery (including BRAC birthing hut) increased more in the project area than in the comparison area over the years; this increased to 59% in 2011 from 15% in 2007 in the project area than in the comparison area; this increased to 28% in 2011 from 25% in 2007. In the project area, 23% of the deliveries took place in the BRAC delivery hut in 2011 compared to just 1% in 2007, or 3% in the comparison area in 2011. Short duration of living in enumeration slum and history of migration from rural or urban areas were associated with lower percentage of institutional delivery in either area. Likelihood of institutional delivery was higher for births of the first-order than four- or higher-order, for women with secondary education than no education, and the least poor than poorest households in either area. Institutional delivery became more equitable (measured in terms of difference between sub-groups of birth-order, education, and asset score) in the project area than the comparison area over the years. The caesarean section (C-section) rate increased to 24% in 2011 from 6% in 2007 in the project area, and in the comparison area; this increased to 14% in 2011 from 11% in 2007. C-section varied widely by household asset quintile in both areas. The economic differential in C-section was lower in the project area than in the comparison area. Type of institution was related to C-section; more than two-thirds (69-70%) of the deliveries in private clinics had C-sections compared to half (53-54%) of the deliveries in public hospitals in 2011. Out-of-pocket expenditure was lower for normal vaginal delivery but not for C-section in the project area than in the comparison area. In 2011, normal delivery at home in the project area, on an average, cost Taka 1,452; normal delivery at institution cost Taka 2,181 and C-section cost Taka 12,714. The respective averages in the comparison area were Taka 1,821, Taka 3,823, and Taka 11,289.
Impact Evaluation Surveys in Dhaka Urban Slums 2007, 2009 and 2011 v
Use of Misoprostol for prevention and treatment of postpartum bleeding was more frequent
(53% versus 27%) in the project area than in the comparison area in 2011.
Deliveries assisted by medically-trained persons, such as doctors (28%), BRAC midwife
(23%), and nurse/midwife/family welfare visitors (9%) were higher in 2011 than in 2007
(8%, 1%, and 5% respectively) in the project area. In the comparison area, the medically-
trained persons were doctors (17%) and nurse/midwife/family welfare visitors (8%) in 2011
and comparable with 2007 (14% and 10% respectively).
More women received PNC after delivery in 2011 than in 2007 (66% versus 28%) in the
project area and also in the comparison area (33% versus to 40%). Coverage of recommended
three or more PNC visits was higher (20% versus 8%) in 2011 than in 2007 in the project
area but not in the comparison area (9% versus 13%).
Short duration of living in enumeration slum or history and migration from rural or other
urban areas was associated with lower coverage of PNC visits in either area.
Coverage of PNC has been higher for births of the first-order than four- or higher-order,
women with secondary education than no education and the least poor than the poorest
households in either area.
PNC services became more equitable (indicated by decline in gaps between sub-groups of
birth-order, education, and asset quintiles) in the project area than the comparison area over
the years.
Institutions that were used more often for PNC included BRAC delivery huts (24%), private
clinics (15%), and government hospitals (15%) in the project area in 2011 compared to 2%,
4%, and 7% respectively in 2007. In the comparison area, institutions for PNC were
government hospital (15%), private clinics (8%), and NGO clinics (5%) in 2011 compared to
10%, 11%, and 9% respectively in 2007.
More common self-reported pregnancy complications were oedema of hands/feet, abdominal
pain, severe headache/blurry vision, and high fever in the project and the comparison areas in
2011.
For treatment of pregnancy complications, women more often used NGO health centres,
private clinics, and government hospitals in either area.
Immediate Newborn Care Practices
Colostrum as pre-lacteal feed after birth was given more often in the project and the
comparison areas in 2011 (77% and 61% respectively) than in 2007 (36% and 43%
respectively). Over the years, use of honey and sugar/glucose water as pre-lacteal feed
reduced at faster rates in the project area than in the comparison area.
Impact Evaluation Surveys in Dhaka Urban Slums 2007, 2009 and 2011 vi
The percentage of breastfeeding within an hour of birth increased in both areas; the rate of
increase was higher in the project area (from 50% in 2007 to 71% in 2011) than in the
comparison area (from 49% in 2007 to 62% in 2011) over the years.
Practice of giving bath just after birth reduced more in the project area (from 55% in 2007 to
16% in 2011) than in the comparison area (from 45% in 2007 to 29% in 2011) with
simultaneous increase in giving bath within third day to one week after birth in the project
area only.
The practice of shaving baby's hair within the third day to one week after birth was very high
in either area with a faster declining trend in the project area (from 91% in 2007 to 72% in
2011) than in the comparison area (from 85% in 2007 to 77% in 2011).
Health check-up of neonates increased at a faster rate (from 40% in 2007 to 67% in 2011) in
the project area but not in the comparison area (from 50% in 2007 to 39% in 2011) over the
years.
Two-thirds of the neonates had no reported illness or complications in either area each year.
Illnesses in order of prevalence were fever, followed by cough, difficult breathing, jaundice,
and skin rash/pustule in either area.
Places for treating neonatal complications were private clinics, government hospitals and
pharmacies in either area. Frequency of using pharmacy was lower in the project area than in
the comparison area (4% versus 8%) in 2011.
Child (aged 1-4 years) Health Services
Complete vaccination (BCG, three doses of DPT and Polio, and Measles) coverage increased
more in the project area (from 38% in 2007 to 79% in 2011) than in the comparison area
(from 38% in 2007 to 69% in 2011) over the years.
Distribution of childhood illnesses was similar across areas. The most common childhood
illnesses were fever, followed by cough, difficult breathing, and diarrhoea. Prevalence of
acute respiratory infection (ARI) declined a little in the project area (from 11% in 2007 to 8%
in 2011) but not in the comparison area (from 11% in 2007 to 10% in 2011).
Seeking treatment was less frequent for diarrhoea than for ARI. Common places for treatment
of ARI and diarrhoea were pharmacies, private clinics, and government hospitals in either
area.
Perception on Local Delivery Facilities and BRAC Birthing Hut in Project Area
Women's knowledge relating to healthcare and delivery facilities in their localities increased
more in the project area (from 53% in 2007 to 94% in 2011) than in the comparison area
(from 45% in 2007 to 63% in 2011).
Impact Evaluation Surveys in Dhaka Urban Slums 2007, 2009 and 2011 vii
Health facilities mentioned more frequently in 2011 in the project area were BRAC delivery hut (86%), NGO-operated health centre (35%), and private clinic (19%) and that in the comparison area were private clinic (43%) and NGO health centre (35%). Aspects of healthcare and facilities that satisfied women were good behaviour of the staff, availability of drugs and supplies, effective treatment, and less waiting-time in either area. Women's knowledge about the existence of BRAC birthing huts in their localities increased from 25% in the 2007 to 90% in the project area. By 2011, 83% of the women became aware of availability of ANC, 59% were aware of skilled delivery assistance, 42% were aware of delivery care, and 27% were aware of newborn care in a birthing hut. Most common sources of information on services a deliver hut offers were BRAC staff (66%), followed by own experience (24%), and neighbour/friend (17%). Registration with BRAC birthing huts increased from 7% in 2007 to 62% in 2011 for accessing antenatal check-up (59%), skilled delivery assistance (42%), delivery care (32%), and newborn care (18%). In conclusion, the project has been able to improve practices more than knowledge on maternal and newborn care and to reduce the inequalities in practices over the years. Lessons learnt from this intervention must be used effectively to further develop and improve the MNCH services in order to move towards a sustainable scale-up at the national level.
Impact Evaluation Surveys in Dhaka Urban Slums 2007, 2009 and 2011 viii
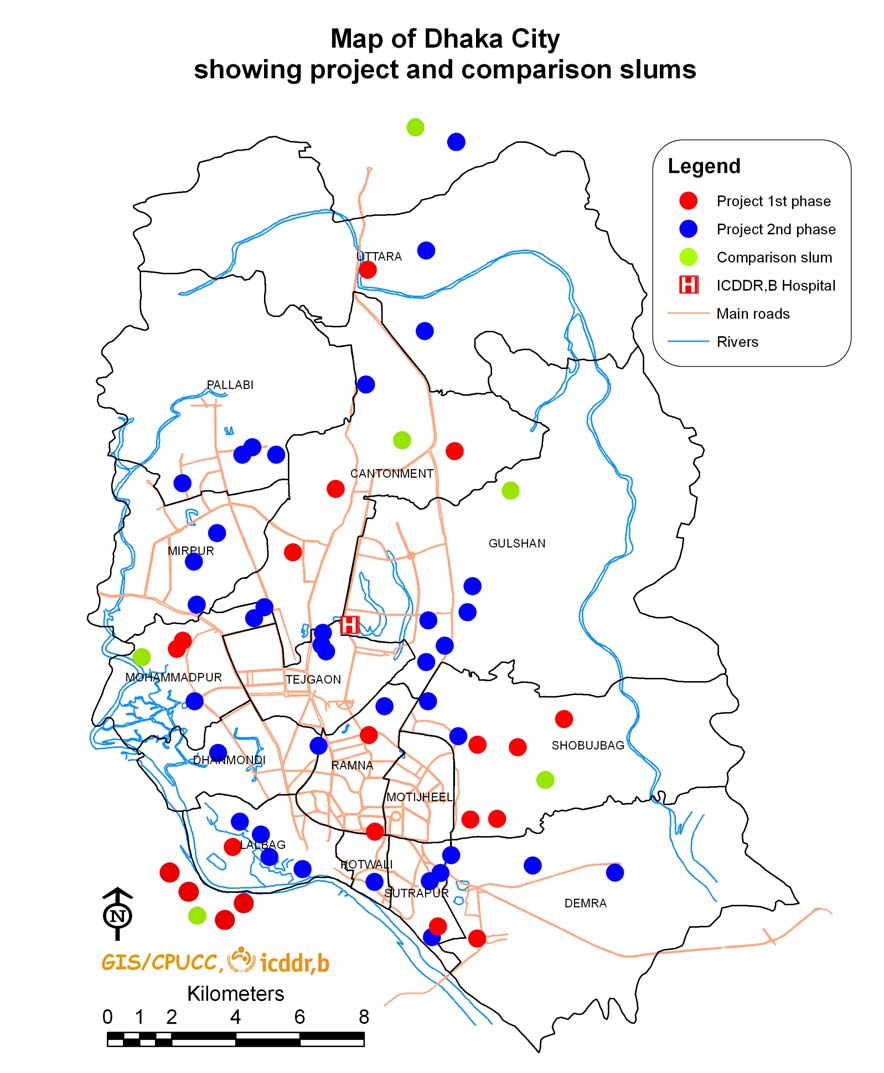
Figure 1:
MAP OF DHAKA CITY CORPORATION
Impact Evaluation Surveys in Dhaka Urban Slums 2007, 2009 and 2011 ix
CHAPTER 1: INTRODUCTION
Urbanization is an inevitable and unavoidable feature in a society's development process.
Bangladesh, along with other Asian countries, has been experiencing rapid urbanization in
recent decades (1, 2, 3). The Bangladesh Bureau of Statistics―the national statistical
organization of the government―projected that fifty percent of the Bangladesh population
would be living in urban areas by 2035, and the majority would be living in Dhaka city (4).
The increase in urbanization is due to (a) rural- urban migration, (b) geographical increase in
urban territory, and (c) natural growth of population in urban area. The rural-urban migration
contributes most to rapid urbanization. Distant factors accelerating the rural-urban migration process are natural disasters, high
population density, high population growth, small farm-size, landlessness, and poor
communication infrastructure (5). Natural disasters, such as cyclone, flood, river erosion or
drought affect thousands of rural households every year. Frequent flood and river erosion
damage the rural infrastructure. Overall, population density is far higher than any other
country that is not a city state (4). Agricultural land is virtually saturated. High population
growth continuously shrinks availability of per-capita agricultural land, and makes 1 percent
of it into non-agricultural land every year (6). All these together accelerate the ongoing
process of increasing number of landless households and diminish job opportunities in rural
In an era of globalization, economic and labour migration, both internal and international, is
on the rise. Migration is an option to escape from deteriorating economic and social
conditions at place of origin. Labour and economic migration from rural to urban areas in
Bangladesh is predominantly due to shortage of agricultural land, small farm-size, surplus
agricultural labour, the seasonal nature of agricultural work, and occasional natural disasters.
The poor lack the financial and social resources required to live there. Many, already
destitute, do not have a decent place to live. To cope with the situation they migrate to towns
and cities in search of employment or scope of earning (7), indicating a clear link between
rural poverty, migration and urbanization. The urban poor are largely rural migrants and find
shelter in overcrowded slums with inadequate sanitation and other civic facilities. Migration
and health connection is bidirectional and in the dynamic perspective it gives us the
opportunity to look at it both ways. Altogether, rapid urbanization in Bangladesh raises new
challenges for parties aiming to serve the poor and address poverty.
Most migrants from rural areas come to the already over-crowded Dhaka city, with around
one-third living in informal settlements under unhealthy and unsafe conditions (8).
Implications of unbridled urban growth and proliferating slums are high unemployment and
underemployment, overcrowded housing, deterioration of environmental conditions,
inadequate supply of clean water, high incidence of diseases and poverty and overcrowding
in schools and hospitals. The other implications are overloading in public transports and
increase in traffic jams, road accidents, violence, crimes, and social tension. All these make
the conditions more unhealthy and unsafe and challenge heavily the capacity of urban centres
to cater for the basic civic needs of newcomers.
1.1 Health Services Delivery for Urban Poor
Compared to rural primary healthcare (PHC) infrastructure, the urban PHC infrastructure that could help improve the health of the urban poor is underdeveloped (9, 10). Although the urban population has been increasing rapidly for a longer period of time, the government and external donor agencies have started addressing urban PHC problems only in the last decade.
Impact Evaluation Surveys in Dhaka Urban Slums 2007, 2009 and 2011 1
Under the present PHC system, slum-dwellers in metropolitan cities of this country need to seek treatment and care directly from tertiary-level hospitals and facilities, which involves time, money and, sometimes, negligent and incompliant behaviour on the part of the care-seekers. For improving the health of the urban poor, particularly women and children through improved access and provision of health services in urban areas, the Urban Primary Health Care (UPHC) Project was initiated in 1998 (9). The project established 142 PHC delivery centres in the four major cities of the country, including 60 solely in the Dhaka City Corporation (DCC) for delivering good quality preventive, promotional and curative services. DCC has signed the contract with selected competitive NGOs for delivering a package of essential health services and comprehensive emergency obstetric care (EOC) in 10 defined partnership areas, linking contract payments to improve health of the population in the project area. The interim poverty reduction strategy paper (PRSP) and the targets set on poverty reduction reflect the government's commitment to achieving the MDGs by strengthening urban PHC, especially for the poor.
The second project called ‘Urban Primary Health Care Project II (UPHCP-II)' covers the six city corporations and five selected municipalities of Bangladesh for the period 2005-2011 with:
focus on providing a package of essential primary health services with an emphasis on preventive intervention, giving priority to maternal and child health;
expand the role of the private sector, including NGOs in the provision of health, nutrition and population services;
take gender, equity, poverty and developmental issues into account in designing and provision of services;
expand cost recovery and improve efficiency of resource utilization in the public sector;
involve beneficiaries in the management of healthcare;
emphasize on the sustainability and environmental issues; and
endeavour to provide one-stop shopping for health and population services (11)
The Health, Nutrition and Population Sector Project (HNPSP), currently, a new
HPNSDP (2011-2016) of the Ministry of Health and Family Welfare, Government of
Bangladesh embodies all of these and adds a few new dimensions, e.g. risk-sharing and risk-
spreading to address catastrophic illnesses and piloting of demand-side financing in different
forms and decentralization of decision-making by the lower level managers (12). The project
aims to contribute towards achievement of the Millennium Development Goals (MDGs)
undertaken at the Millennium Summit 2000 of UN.
1.2 Launching of the Manoshi Project
The slums have a disproportionate share of the poor and have worst health status originating
from lack of basic social and public-health services. BRAC has designed an intervention in
2007, called Manoshi, a five-year project to improve maternal, newborn, and child health in
the urban slums of Bangladesh through the implementation of a community-based
programme on comprehensive package of essential health services. The project focused
primarily on enhancing the empowerment of communities, e.g. women to develop a system
for the continuum of care for mothers and babies with an essential service package of
Impact Evaluation Surveys in Dhaka Urban Slums 2007, 2009 and 2011 2
interventions. The components of the project include: capacity development of the
community health workers and birth attendants to offer basic maternity services; health
service provision for pregnant and lactating women, neonates and under-five children; timely
referral to quality health facilities; community empowerment through development of
women's groups; and linkage with government, local government, community people and
NGOs. The community health workers are to visit households and identify pregnancies and
follow them up no matter where women seek care from BRAC delivery hut. The project has
gradually expanded its activities to all the slums under the Dhaka City Corporation and
peripheral unions under the metropolitan area by 2009 and to all the slums in all other city
corporation areas by 2011.
The impact evaluation surveys aim to examine how effective is the Manoshi project in
improving knowledge and practices relating to maternal and newborn care in slums of Dhaka
city. The results will help to have a distinct vision and clear strategies to address maternal,
newborn and child healthcare in urban slums.
1.3 Slums under Dhaka Metropolitan Area
The Dhaka Metropolitan Area (DMA), with an estimated population of 9.1 million in 2005,
comprises area under Dhaka City Corporation (DCC) and adjoining areas totalling 306 sq.
kilometres. The 2005 Slum Census of Urban Bangladesh identified 4,966 slum clusters in
DMA with a total slum population of 3.4 million (37.4% of the total population in
DMA)―more than double the slum population counted in 1996 (3).
The 2005 slum survey also identified conspicuous growth of slums in peripheral and
suburban areas of Dhaka city. In the central areas of the city, slum concentrations are
relatively sparse compared to the periphery. The major slum concentrations in DMA are as
follows:
• Eastern fringe of the city, along the border of the city corporation:
Khilket, directly opposite to the Dhaka Airport Badda-Satarkul area, in the vicinity of the Gulshan and Baridhara residential areas Area between Meradia and the Kamalapur Railway Station
• Western fringe of the city:
Kamrangir Char on the bank of the river Buriganga, just outside the DCC border Hazaribagh and West Mohammadpur, along the western embankment Mirpur
The single largest concentration of slums is in Kamrangir Char, having a slum population of 265,000. The largest single slum in Dhaka city is Korail in Mohakhali near Gulshan, with more than 100,000 people (3).
Impact Evaluation Surveys in Dhaka Urban Slums 2007, 2009 and 2011 3
1.4. Methodology of Manoshi Project Impact Evaluation
Study Design: The target populations of the Manoshi project are: (a) pregnant women, and
(b) mothers of newborn and child. The impact evaluation surveys targeted mothers with
infant and mothers with 1-4 years old child, and followed the six-cell (baseline, midline and
endline surveys in the project and comparison slums) study design to assess the effects of the
project on knowledge and practices relating to maternal health services and newborn care in
urban slums of Dhaka, Bangladesh.
Impact Surveys: The major challenge for the impact evaluation of the Manoshi project
activities is the lack of non-project slums for follow-up to control for secular changes. BRAC
has expanded the Manoshi project in two phases and covered all slums (except a few) in
DMA by 2009. The first phase is implemented in Gulshan, Shyampur, Kamrangir Char,
Shabujbag, Mohammadpur, and Uttara – these constituted the project area. The comparison
slums are chosen around the project slums. These are Badda, Hazaribagh, Jatrabari, Khilkhet,
Meradia, and Mirpur, constituting the comparison area. The sample-size of the project and
the comparison groups in the baseline survey 2007 was equal.
The second phase of the Manoshi project covered all slums in DMA, except for slum
households in Nikunja Housing area in Khilkhet Thana, Dhaka Uddyan in Adabar Thana and
Baraid in Badda Thana. Lack of enough households to make the comparison groups forced
us to make the project and the comparison groups unequal; 2:1.
Limitations of the Impact Study: In absence of enough slum households without Manoshi
project activities in the DMA, the comparison group included a few slums in DCC and a
number of slums selected from periphery of DCC. Arguably, the comparison and project
slums were dissimilar in terms of access to health facilities, tenant status and economic
condition. Nonetheless, such a comparison group is better than having none at all, to control
for secular changes due to non-project and extraneous factors. Analysis, however, controls
the effects of some of the factors that differentiate the project group from the comparison
group.
1.5 Organization of the Manoshi Impact Evaluation Surveys
1.5.1 Survey Objectives and Implementing Organization
Impact evaluation surveys in 2007, 2009, and 2011 collected data on knowledge, perception,
and practices relating to maternity care, newborn, and childcare of women having under-five
child(ren) living in slums in the DMA. Sample-size, sampling design, and selection of
primary sampling units were determined by icddr,b and shared with the Technical
Management Committee of the project. All three surveys were implemented by a private
survey organization entitled "Associates for Community and Population Research (ACPR,
email: [email protected])". The overall objective of the surveys was to estimate changes
(improvements) over the years in knowledge and practices relating to maternal, newborn and
childcare in the project slums compared to the comparison slums. The specific objectives
were:
Impact Evaluation Surveys in Dhaka Urban Slums 2007, 2009 and 2011 4
• Assess levels of women's knowledge and perceptions relating to antenatal care,
delivery care and postnatal care, and care of neonates and sick children living in the project and comparison areas in 2007, 2009, and 2011.
• Assess levels of women's practices relating to maternity care, and care of neonates
and sick children living in the project and comparison areas in 2007, 2009, and 2011.
• Assess the effects of the Manoshi's project on women's knowledge and practices
relating to antenatal care, delivery care and postnatal care, and care of neonates and sick children, controlling for socioeconomic and demographic factors.
• Assess socioeconomic differentials (i.e. equity) in women's practices relating to
maternity care, and care of neonates in the project area compared to the comparison area over the years.
1.5.2 Sampling Design of the Surveys
The two-stage random-cluster sampling was followed in all three surveys (the baseline survey
2007, the midline survey 2009, and the end line survey 2011) for selecting sampling units.
The first stage was the random selection of clusters (of slums) by PPS (probability
proportional to size measured in terms of number of households), and the second stage was
selection of households with eligible women. As mentioned before, a few slums in the DMA
outside the purview of the Manoshi's project are not enough to make a comparison group of
equal size to the project group, the sample-size for the comparison group was made half the
size of the project group (the project sample ratio was 1:2) in the midline survey 2009 and the
endline survey 2011.
Sample-size: The sample-sizes of the project and comparison groups in three surveys are
shown below (Table 1). Indicators that were used in estimating the sample-size are antenatal
care visits (4 or more), facility delivery, any postnatal care visit, child immunization
coverage, and sickness care. The sample-size of the baseline survey 2007 was 2,874, the
midline Survey 2009 was 3,608, and the endline survey 2011 was 3,777 women.
Table 1. Sample-size of the baseline, midline and endline surveys for estimating maternal,
newborn and childcare indicators
Baseline survey 2007 Midline survey 2009 Endline survey 2011
Mothers with infant Project
Comparison 612 536 562 Mothers with 1-4 year old child Project
Comparison 783 667 720
Total number
Selection of the sampling units: Manoshi project prepared a list of slums and divided them
onto blocks (or clusters), each of 175-200 households (a working unit of a BRAC community
health worker called ‘Shashthya Sebika'). This list served as sampling frame for the first
stage of sampling 100 clusters (50 from the project area and 50 from the comparison area) for
Impact Evaluation Surveys in Dhaka Urban Slums 2007, 2009 and 2011 5
the baseline survey 2007. The numbers of clusters in the project and the comparison areas
were 67 and 33 respectively in the midline survey 2009 and the endline survey 2011. Samples
of the intervention groups of the midline and the endline surveys were selected
proportionately from slums covered in the 1st and 2nd phases of the Manoshi project. The
project clusters consisted of 32 from the first phase and 35 from the second phase. The
comparison sample included some clusters of impoverished households in Demra, Jingira,
Keraniganj, and Tongi―the outreach of the Manoshi's project to serve as comparison group.
The second stage of the sample selection was the selection of households with mothers
having infants or children of 1-4 year(s). A household listing operation was carried out to
update the list and identify households with mothers of infant or child aged 1-4 years in each
selected cluster. The resulting lists of the households served as sampling frame for selection
of households with mothers for interview. The required number of mothers of infants and 1-4
year old children was selected in each cluster through random systematic sampling.
1.5.3 Survey Questionnaire
The baseline questionnaire with some modifications was used in the midline and the endline
surveys. Modifications are inclusion of a few variables: ‘date of start of the activity of the
BRAC delivery centre in the catchment slums', ‘use of Misoprostol tablets after delivery',
and ‘exposure to the Manoshi project'.
Data analysis: Both bivariate and multivariate analyses were carried out to assess changes or
trends in measurable indicators of maternity and newborn care in the project and the
comparison areas over the years. Bivariate analysis shows percentage, rate or mean of the
indicators for different categories of socioeconomic and demographic factors within the area
over the years. Multiple logistic regression models estimate time trends (in terms of odds
ratio) in the indicators and their associations with different socioeconomic and demographic
factors within the area. The dose-response relationship (i.e., the longer the exposure to the
project the higher is the rate of change in measurable maternal and newborn care indicators)
is also used in assessing the trends.
Impact Evaluation Surveys in Dhaka Urban Slums 2007, 2009 and 2011 6
CHAPTER 2: HOUSEHOLD POPULATION AND HOUSING
This chapter presents information on demographic and socioeconomic characteristics of the
household populations of the baseline survey 2007, the midline survey 2009, and the endline
survey 2011, including age, sex, and marital status (for members aged 10 years or more),
pregnancy status (for married female members of the household), and educational attainment
(for members aged 5 years or older). The chapter also describes the conditions of the
households in which the survey populations live, including source of drinking-water,
sanitation facilities, availability of electricity, housing construction materials, possessions of
household durable goods, and ownership of homestead land. Data on household durables and
drinking-water source, sanitation facilities, quality of housing materials are used in creating a
composite indicator of household economic status called the wealth index.
The definition of household has been the same in the three surveys. A household is defined as
a person or a group of related and/or unrelated persons who usually live in the same dwelling
unit(s), who have common cooking and eating arrangements, and who acknowledge one adult
member as a head of the household. A member of the household is defined as any person who
usually lives in the household. This definition is consistent with the Demographic and Health
Survey (DHS) definition.
The characteristics of the household population are analyzed based on the de jure population
while household characteristics are presented based on the de facto population, in order to
maintain comparability of these results with other DHS reports. Tables present results of the
surveys to highlight changes in each area over time.
2.1 Household Population by Age and Sex
The age-sex distribution of the population from sampled households of the three surveys in
2007, 2009, and 2011 is shown in Table 2.1.1 and further illustrated by sex ratios ( ×100) in Table 2.1.1a. The age distribution shows a young population age-structure with more than 42% of the population under 15 years of age and more than 45% aged 15-44 years in the project and the comparison areas. As expected, one-fourth of the people are children less than five years of age.
Impact Evaluation Surveys in Dhaka Urban Slums 2007, 2009 and 2011 7
Table 2.1.1a. Percent distribution of the de jure household population by age, sex, and area in
Dhaka urban slums, 2007, 2009, and 2011
Project area
Comparison area
2007 2009 2011 2007 2009 2011 2007 2009 2011 2007 2009 2011
26.3 26.1 25.2 25.8 25.8 24.4 25.0 26.2 26.8 25.1 26.8 25.7
19.8 15.7 16.5 19.7 16.7 16.8 19.1 19.0 17.2 18.4 18.3 18.5
26.3 28.2 27.1 10.2
25-34 21.0 26.2 26.8 17.4 17.9 19.3 23.2 26.1 25.6 17.1 16.4 17.5 35-44 13.3 14.2 13.2 5.2
45-59 6.0 5.3 5.4 4.0
% 100.0 100.0 100.0 100.0
100.0 100.0 100.0
3078 4861 5354 3183
3095 2496 2697
The overall sex ratio is below 100.3 – the national estimate, revealing that females outnumber males in each area and year. For age-group 15 to 24 years, the female population in urban slums of Dhaka is markedly larger than the male population and for age-groups 25 to 44 years, the male population is larger than the female. This is expected as slums are the major residing places of migratory young males looking for earning opportunities in the transport, construction, and manufacturing, and young females in manufacturing and ready-made garments sectors.
Table 2.1.1b. Distribution of the sex ratio ( ×100) by age and area in Dhaka urban
slums, 2007, 2009, and 2011
Project area
Comparison area
Age-group
2007 2009 2011 2007 2009 2011
117 140 136 132 153 140
249 267 281 249 282 288
145 122 92 113 132 103
141 135 142 115 134 126
all 97 96 98 97 97 95
In Bangladesh, most households are ‘male-headed', and so are the households in slums (Table 2.1.2). Only 4-7% of the households are headed by females, and the percentage has declined over the years in either area. The three-fourths of the households consisted of 3 to 5 members in each area and year. The average household-size is slightly lower in 2011 (4.7
Impact Evaluation Surveys in Dhaka Urban Slums 2007, 2009 and 2011 8
persons in the project area and 4.6 in the comparison area) than in 2007 (4.8 persons each in the project and the comparison areas).
Table 2.1.2. Percent distribution of household by sex of household head, household-size in
urban slums of Dhaka, 2007, 2009, and 2011
Project area
Comparison area
2007 2009 2011 2007 2009 2011
Sex of household head
Number of household members
Number of households
Mean household-size
2.2 Educational Attainment
Studies have shown that education is one of the major socioeconomic factors that influence a
person's behaviour and attitudes and has a significant effect on access to health services. In
general, the higher a person's education level, the more knowledgeable s/he is about the use
of health services, family planning methods, and hygiene practices. For all household
members aged 5 years or older, data were collected on the level of education last attained and
the highest class completed. Table 2.2.1 shows the percent distribution of household
population aged 5 years or older living in slums by educational attainment in 2007, 2009, and
2011. Educational attainment in terms of ‘ever attending school/madrasah' and ‘highest class
passed' is higher in 2011 than in 2007 in the project and the comparison areas (68-72%
versus 56-65%). Other than secular schools, percentage of household members attending
madrasah (Islamic faith schools), non-formal (under Government's Mass Literacy Project)
and non-institutional (vocational training) schools was very low each year. Educational level
of class 10 or more in the project area in 2011 was more than double (9%) that in the project
area in 2007 (3%). In the comparison area, this was lower in 2011 than in 2007 (4% versus
8%).
Impact Evaluation Surveys in Dhaka Urban Slums 2007, 2009 and 2011 9
Table 2.2.1. Percent distribution of household population aged 5 years or older by education
in Dhaka urban slums, 2007, 2009, and 2011
Ever attended educational
Project area
Comparison area
institution and class passed
2007 2009 2011 2007 2009 2011
Ever attended school/madrasah
Type of school attended
Non-institutional 0.5
Level of education (class passed)
Primary incomplete
Primary complete
Secondary incomplete
Secondary complete or more
Total number
2.3 Household Characteristics
The ever-increasing number of landless households and diminishing job opportunities in the
rural areas are pushing people to migrate towards towns and cities in search of employment.
They, already destitute, do not have a decent place to live in their places of origin. They find
shelter in overcrowded slums with inadequate sanitation and other decrepit civic facilities.
The three surveys in 2007, 2009, and 2011 collected data on certain characteristics of
households, including the source of drinking-water, type of sanitation facility, main housing
materials, and access to electricity. These physical characteristics of a household are
important because they are used in assessing the general well-being and socioeconomic status
of the household members.
Table 2.3.1 presents the percent distribution of households by their characteristics in urban
slums of Dhaka in 2007, 2009, and 2011. The percentage of households with electricity
connections was higher (99%) in 2011 than in 2007 (89%) in the project area. In the
comparison area, this was 96% in 2011 compared to 95% in 2007. Availability of piped water
inside dwelling was higher in 2011 than in 2007 in the project area (65% versus 56%) and in
the comparison area (75% versus 65%). Possession of modern toilet or water-sealed slab
latrine was higher in 2011 than in 2007 (73% versus 33% in the project area and 68% versus
59% in the comparison area). In the 2007, 2009, and 2011 surveys, jhupri type of dwellings
(makeshift dwelling of low height and built with flimsy, temporary materials like polythene,
Impact Evaluation Surveys in Dhaka Urban Slums 2007, 2009 and 2011 10
board, etc.) accounted for 1-2% of the sampled households. Most of the slum households had tin-roof, cement/concrete or tin walls, and cement floor in the project and the comparison areas. Compared to the 2007 baseline survey, more households had roofs, walls, and floors made of cement/concrete in the project and the comparison areas in 2011.
Table 2.3.1. Percent distribution of households by housing quality in Dhaka urban slums,
2007, 2009, and 2011
Project area
Comparison area
Housing quality
Electricity connection
Source of drinking-
water
Piped inside dwelling
Piped outside dwelling
Sanitation facility
Water-sealed/slab
13.3 16.5 28.8 17.7 21.4
latrine Pit-latrine 40.8
Open latrine/bush/field
Pond/tank/canal/river 1.9 0.3 0.3 0.4 1.3
Type of main dwelling
Main roof material
Main wall material
Floor material
Total number
Impact Evaluation Surveys in Dhaka Urban Slums 2007, 2009 and 2011 11
2.4 Household Possessions of Durable Assets
Data on household's ownerships of selected durable assets were collected in 2007, 2009, and
2011. Some of these are used in generating a wealth index. The percent distribution of
households that possess various durable goods in the project and the comparison areas in
2007, 2009, and 2011 is shown in Table 2.4.1. Overall, ownerships of durable assets, except
for radio and bicycle, were more common in 2011 than in 2007 in either area. In 2011,
ownerships were more common in the project area than in the comparison area. More
households owned a mobile phone in 2011 than in 2009 and 2007, when more households
owned a radio in either area.
Table 2.4.1. Percent distribution of households by durable assets in Dhaka urban slums,
2007, 2009, and 2011
Project area
Comparison area
Household assets
2007 2009 2011 2007 2009 2011
Almirah/wardrobe 31.3
Chair/bench 26.6
Clock/watch 50.0
Rickshaw/van 6.1
Total number
2.5 Socioeconomic Status and Wealth Index
A composite wealth index is tested in a large number of countries in relation to inequities in household expenditure and income, use of health services, and health outcomes (14). The index is an indicator of the level of wealth that is assumed to be consistent with expenditure and income measures. The index is constructed from data on household ownerships of durable goods (almirah, table, chair, radio, television, watch, bicycle, motorcycle, rickshaw, CNG scooter, sewing machine, and mobile phone) and dwelling characteristics (such as source of drinking-water, sanitation facilities, and construction materials). The principal components analysis of the durables retained one factor and assigned a factor score to each household. The higher the score the higher was the number of household assets, indicating better long-term economic status of the household. The factor score was used in dividing the households into quintiles – from the lowest 20% to the highest 20%. Table 2.5.1 shows descriptive statistics and factor loadings of the household assets (including basic amenities and structural materials of the household) in 2007, 2009, and 2011. On the basis of factor loadings, only significant variables at 1% level of significance are retained in the final principal components analysis (15, 16).
Impact Evaluation Surveys in Dhaka Urban Slums 2007, 2009 and 2011 12
Table 2.5.1. Mean and factor loadings of standardized variables used for constructing asset
score in Dhaka urban slums, 2007, 2009, and 2011
Selected household
Mean Factor
possessions
2007 2009 2011 2007 2009 2011
Piped inside dwelling
0.601 0.574 0.680 0.244 0.134 0.278
(Yes=1, No=0)
Sanitation facility
No=0) 0.332 0.104 0.274 0.179 0.220 0.201
0.154 0.181 0.269 0.028 0.131 0.098
Open latrine/bush/field
0.305 0.694 0.446 0.339 0.303 0.292
(Yes=1, No=0) Electricity
0.921 0.960 0.982 0.379 0.323 0.298
Household assets
Almirah/wardrobe (Yes=1,
0.366 0.396 0.589 0.609 0.660 0.671
0.291 0.329 0.364 0.588 0.646 0.595
No=0) 0.299 0.320 0.376 0.636 0.683 0.627
0.156 0.774 0.046 0.285 0.305 0.145
0.489 0.571 0.623 0.661 0.704 0.658
No=0) 0.576 0.498 0.517 0.646 0.654 0.631
0.049 0.024 0.031 0.214 0.117 0.137
No=0) 0.006 0.009 0.121 0.130 0.157 0.117
Rickshaw/Van (Yes=1,
0.058 0.039 0.535 0.039 0.022 0.059
No=0) CNG scooter (Yes=1, No=0)
Sewing machine (Yes=1,
0.051 0.068 0.089 0.307 0.226 0.197
No=0) Mobile phone (Yes=1, No=0)
Main roof material
No=0) 0.062 0.123 0.154 0.323 0.367 0.383
Main wall material
No=0) 0.422 0.594 0.638 0.665 0.610 0.646
Floor material
0.666 0.805 0.837 0.594 0.533 0.576
Household durables of the three surveys are merged together and the principal components analysis is conducted to retain one factor and assign a factor score to each household. Table 2.5.2 shows the percent distribution of households by asset quintiles in the project and the comparison slums over the years. Economic position of slum households improved over the years; it has been more frequent in the project area than in the comparison area. More
Impact Evaluation Surveys in Dhaka Urban Slums 2007, 2009 and 2011 13
households of the 2007 baseline survey belonged to the poorest quintile than households of
the 2009 midline survey or the 2011 endline survey in the project area. On the other hand,
more households of the 2011 endline survey belonged to the least poor quintile than the
households in the 2007 baseline survey or the 2009 midline survey.
Table 2.5.2. Percent distribution of women by household asset quintiles by area in Dhaka
urban slums, 2007, 2009, and 2011
Project area
Comparison area
Asset quintile
2007 2009 2011 2007 2009 2011
39.4 16.7 12.0 22.5 24.6 14.2 20.1
23.4 18.2 16.8 19.7 24.8 20.6 19.9
19.0 20.1 20.0 19.9 20.7 22.4 20.2
10.4 19.8 23.7 19.9 16.9 25.1 19.8
7.8 25.1 27.5 18.0 13.1 17.7 20.1
100.0 100.0 100.0 100.0 100.0 100.0 100.0
1,256 2,172 2,269 1,227 1,054 1,129 9,107
Impact Evaluation Surveys in Dhaka Urban Slums 2007, 2009 and 2011 14
CHAPTER 3: CHARACTERISTICS OF SURVEY WOMEN
This chapter describes the demographic and socioeconomic profiles of women interviewed in 2007, 2009, and 2011. These surveys collected basic information on women's age, level of education, marital status, and religion. Information is also collected on women's exposure to mass media, employment status and occupation, type of employment, income and expenditure, NGO involvement, and migration history.
3.1 Background Characteristics of Women
Table 3.1.1 shows the percent distribution by selected background characteristics, of women interviewed in the 2007, 2009, and 2011 surveys. Age distribution of the sampled women of the three surveys in the project and the comparison areas were comparable. Majority of women were aged between 20 and 29 years. In both project and the comparison areas, women were predominantly Muslim (96-99%) in either survey. The rate of the ‘currently married women' was similar in the project and the comparison areas in 2007, 2009, and 2011.
The educational attainment of its population is an important indicator of a society's stock of human capital and its level of socioeconomic development. Education also enhances the ability of individuals to achieve desired demographic and health goals. The percentage of women with no education was the lowest in 2011, followed by 2009 and 2007 in the project area (26, 32, and 51% respectively), and this was not the case in the comparison areas (30, 42, and 37% respectively). As expected, the percentage of women with secondary education (class VI+) was the highest in 2011, followed by 2009, and 2007 in the project area. In the comparison area, the percentage of women with secondary education was comparable in 2007, 2009, and 2011.
Access to mass media: Access to information through the media is essential for updating
knowledge and raising awareness of what is happening around them. The surveys assessed
women's exposure to media by asking if they listened to radio, watched television, or read
newspapers or magazines at least once a week. Among the sampled women, the percentage
of women who read newspapers was higher in 2011 than in 2007 (10% versus 7%) in the
project area but opposite in the comparison area―lower in 2011 than 2007 (5% versus 13%).
Regular exposure to electronic media, i.e. television, was widespread among the women –
watching television project at least once a week was more than 81% in either area in 2007,
2009, and 2011. In comparison to television, women's exposure to radio gradually declined
from 22-24% in 2007 to 4-5% in 2011 in both areas. On inquiry about their current
employment status, fewer women were employed in 2011 compared to 2007 in either area
(17-21% versus 25-26%).
Impact Evaluation Surveys in Dhaka Urban Slums 2007, 2009 and 2011 15
Table 3.1.1. Percent distribution of women by socio-demographic characteristics in
Dhaka urban slums, 2007, 2009, and 2011
Project area
Comparison area
Women's age (year)
Marital status
Currently married
Divorced, separated, or
1.8 0.8 0.5 1.0 1.2 0.8
Married once or more
Married more than once
Education level (classed passed)
Primary incomplete (class
15.4 13.5 15.4 13.7 15.3 21.9
Primary complete (class
15.3 17.3 18.9 17.8 16.6 19.4
Secondary incomplete
16.2 28.0 31.4 23.6 22.5 25.5
Secondary complete or
2.2 9.2 8.3 7.7 4.1 3.5
Regular exposure to mass media
Reads newspapers 7.2
Listens to radio
Watches television
Currently employed
Total number
3.2 NGO Involvement
Table 3.2.1 presents the percent distribution of women by membership of selected non-
government organizations (NGOs) in Dhaka urban slums in 2007, 2009, and 2011. The
percentage of women's involvement with NGOs was lower (9-13% in 2009 and 2011
compared to 23% in 2007) in the project and the comparison areas. A few women (<1%)
Impact Evaluation Surveys in Dhaka Urban Slums 2007, 2009 and 2011 16
were involved in more than one NGO in 2009 and 2011 opposed to 2-3% in 2007. ASA (Assistance for Social Advancement) was the leading NGO in the project and comparison areas in 2009 and 2011 while BRAC was leading in the project area in 2007. Involvement with small localized NGOs was common in both the areas.
Table 3.2.1. Percent distribution of women by NGO involvement and membership in
Dhaka urban slums, 2007, 2009, and 2011
Project area
Comparison area
NGO involvement
Currently involved with NGO
Number of NGOs involved with
Has membership of1
100.0 100.0 100.0
100.0 100.0 100.0
1,256 2,172 2,269
1,227 1,054 1,129
1Among the women who are involved with NGO activities
3.3 Income/Employment Activities
In the 2007, 2009 and 2011 surveys, women (who are employed on the survey date) are asked
a number of questions regarding type and nature of their employment status, and the results
are presented in Table 3.3.1. A major shift was marked in type of employment, with decrease
in percentage of domestic work, daily labour and trading and an increase in the percentage of
service in the project area over the years. Such a shift was not evident in the comparison area.
The most common type of employment was the service in both areas in all years, followed by
domestic work in the project area and skilled labour in the comparison area. The other
common types of employment were daily labour, followed by trading, and making handicraft.
Most of the employed women work round the year in either area. One-third of the women
report sole control over the spending of their income and more than half report joint-control
of husband and wife over the spending of wife's income. There was an increase in percentage
of sole control and a decrease in joint control of wife's income over the years.
Impact Evaluation Surveys in Dhaka Urban Slums 2007, 2009 and 2011 17
Table 3.3.1. Percent distribution of women by employment characteristics in Dhaka urban
slums, 2007, 2009, and 2011
Employment
Project area
Comparison area
2007 2009 2011 2007 2009 2011
Type of employment
Construction work
Nature of employment
Control over spending income1
Respondent and husband
64.3 58.1 57.8 61.2 56.5 45.3
jointly Respondent and someone
1.3 0.8 4.5 5.4 2.5 1.7
else jointly
Total %
Total number
1Applicable for cash incomes only
3.4 Migration History
Traditionally, in-migration, particularly from rural areas, has been the most important factor in the rapid growth of cities and the development of slums. Poor rural migrants concentrate mainly in the slum areas of cities. Sampled women were asked this question 'How long have you been living continuously in the current place of residence?' Information collected through this question was used in determining the status of a respondent as a migrant or a non-migrant as well as to determine his/her duration of residence at the place of enumeration. Persons who had always stayed at the place where they were enumerated were clearly non-migrants, and those who had not always lived in the place of enumeration were considered to be migrants in the enumeration place.
They are asked about previous place of living and reasons for migration and the results are presented in the Table 3.4.1. Women of the 2007 survey were more migratory than their peers in 2009 and 2011. Duration of living in the current slum for less than one year was higher in 2007 than 2009 and 2011 in either area, and so was the living always in the current dwelling less frequent. Majority of the women came from villages, and their percentage
Impact Evaluation Surveys in Dhaka Urban Slums 2007, 2009 and 2011 18
showed a decreasing trend over the years in either area (decreased from 75% in 2007 to 53% in 2011 in the project area and from 68% in 2007 to 50% in 2011 in the comparison area). Women coming from district towns and other towns also increased in either area over the years. Distribution of reasons for migration shows a change in the pattern over the years; income/employment was the most common reason and the proportion increased in either area over the years. The second most common reason in either area was family-related, with a declining trend over the years.
Table 3.4.1. Percent distribution of women by residence status and migration history in
Dhaka urban slums, 2007, 2009, and 2011
Project area
Comparison area
Residence status and migration
Duration of living in current slum (in year)
Place of birth of women
City corporation
Reasons for migration into current locationa
Income/employment 26.6
Eviction from previous place
Security reasons
Total number
aMultiple responses were allowed, 1 Includes the reasons of river erosion, education, etc.
3.5 Reproduction
Sampled women were asked about the number of children ever born, currently living, died, and pregnancy terminations, and the results are presented in Tables 3.5.1 and 3.5.2. The mean number of children ever born to the women was higher in 2007 than in 2009 and 2011 in either area (2.6, 2.1 and 2.1 respectively in the project area, and 2.4, 2.3, and 2.2 respectively in the comparison area). The mean number of children currently living with women was also higher in 2007 than 2009 and 2011 (2.4 compared to 2.0 each in the project area, and 2.2 compared to 2.1 each in the comparison area).
Impact Evaluation Surveys in Dhaka Urban Slums 2007, 2009 and 2011 19
Table 3.5.1. Percent distribution of women by number of children ever born and number of
children currently living in Dhaka urban slums, 2007, 2009, and 2011
Project area
Comparison area
Number of children ever born
2007 2009 2011 2007 2009 2011
6.4 3.6 2.8 5.5 4.5 4.5
6.9 3.1 2.5 5.1 4.4 2.8
Mean number of children ever born
Number of children currently living
4.7 3.0 2.2 3.8 3.6 3.6
3.7 1.7 1.5 2.6 2.5 1.9
Mean number of children currently living
100.0 100.0 100.0 100.0 100.0 100.0
1,256 2,172 2,269 1,227 1,054 1,129
Table 3.5.2 presents the percent distribution of women by pregnancy terminations in last five
years in urban slums of Dhaka in 2007, 2009, and 2011. Here the phrase ‘pregnancy termination'
refers to abortion (spontaneous and induced), menstrual regulation (MR), and stillbirth. Overall,
pregnancy termination was higher in 2007 compared to 2009 and 2011 (10% compared to 3-5%)
in either area (results are not shown). The distribution of the pregnancy terminations by area and
year shows some differences between areas and years. Pregnancy terminations took place more
often in private clinics followed by government hospitals and NGO clinics.
Table 3.5.2. Percent distribution of women by pregnancy terminations and place of treatment for
pregnancy terminations in Dhaka urban slums, 2007, 2009, and 2011
Pregnancy termination type and
Project area
Comparison area
2007 2009 2011 2007 2009 2011
Pregnancy termination type
12.9 10.3 12.7 11.9 9.6 22.5
Stillbirth Spontaneous
32.3 30.9 44.9 25.4 34.6 55.0
22.6 32.4 22.0 16.1 38.5 12.5
Menstrual regulation (MR)
Place of treatment for pregnancy termination1
20.2 27.9 12.7 22.8 23.1 25.0
BRAC delivery hut
14.5 16.2 15.3 12.7 25.0 17.5
30.6 32.4 22.9 41.5 38.5 20.0
21.8 17.6 11.0 14.4 13.5 5.0
100.0 100.0 100.0 100.0 100.0 100.0
Total number
1Multiple responses allowed
Impact Evaluation Surveys in Dhaka Urban Slums 2007, 2009 and 2011 20
CHAPTER 4: KNOWLEDGE ON MATERNAL COMPLICATIONS AND
NEWBORN CARE
Before describing patterns of the use of reproductive health services in Dhaka urban slums, it
is useful to review women's knowledge about these services as it is a major determinant of
utilization. This chapter presents findings of the three surveys conducted in 2007, 2009, and
2011 relating to women's knowledge about services required during pregnancy, during
delivery, and after delivery; life-threatening complications or illness during pregnancy,
during delivery, and after delivery; place of treatment for the complications of the mothers;
newborn and child-feeding practices; and life-threatening health problems and place of
treatment for the newborns during the first week after birth and for children's morbidity.
4.1 Women's Knowledge about Maternal Health Services
Table 4.1.1 presents the percent distribution of women by knowledge about requirements of
antenatal care (ANC) visits, tetanus toxoid (TT) vaccination, and iron supplementation during
pregnancy in Dhaka urban slums in 2007-2011. Women's knowledge about requirements of
ANC visits and TT vaccination is found universal (more than 97%) in either area over the
years. However, knowledge about requirement of four or more ANC visits is 59% and 52%
respectively in the project and the comparison area in 2011―higher than in 2007 and 2009.
Knowledge about requirement of iron supplementation is very high (>90%) in either area and
has increased from 91% in 2007 to 99% in the project area and from 93% in 2007 to 97% in
the comparison area in 2011.
Table 4.1.1. Percent distribution of women by knowledge about services required during
pregnancy in Dhaka urban slums, 2007, 2009, and 2011
Project area
Comparison area
Knowledge about services
Requirement of ANC visit during pregnancy
Number of ANC visits required
Requirement of TT1 vaccination
Requirement of iron supplementation2
Total number
1Tetanus toxoid, 2In tablet or syrup form
Impact Evaluation Surveys in Dhaka Urban Slums 2007, 2009 and 2011 21
Table 4.1.2 presents the percent distribution of women by knowledge about requirements of PNC visits, vitamin A and iron supplementations after delivery in Dhaka urban slums in 2007, 2009, and 2011. Though women's knowledge about requirement of PNC has been very high (>83%); percentage of ‘not required or don't know' has increased; it was 10-17% in 2009 and 2011 compared to 6-8% in 2007 in either area. They were also asked about requirements of vitamin A and iron supplementation after delivery. Their knowledge for iron supplementation has improved, but a little over the years at a differential rate. Knowledge has improved at a higher rate in the project area (from 72% in 2007 to 86% in 2011) than in the comparison area (from 76% in 2007 to 83% in 2011). The respective figures for vitamin A are 67% in 2007 and 84% in 2011 in the project area and 76% in 2007 and 86% in 2011 in the comparison area.
Table 4.1.2. Percent distribution of women by knowledge about services required after
delivery in Dhaka urban slums, 2007, 2009, and 2011
Knowledge about
Project area
Comparison area
services
2007 2009 2011 2007 2009 2011
Requirement of PNC visit
Number of PNC visits required
12.2 11.2 1.5 12.1 21.5 2.6
Requirement of iron supplementation
Requirement of vitamin A supplementation
Total number
Table 4.1.3 presents the percent distribution of women by knowledge of pregnancy complications or illnesses that require immediate medical treatment and source of information on pregnancy care in Dhaka urban slums in 2007, 2009, and 2011. Knowledge of such complications was not widely prevalent in either area. Complications most frequently mentioned were severe headache, followed by convulsion, lower abdominal pain, blurry vision, and oaedema in hands/feet and, high fever and vaginal bleeding. Knowledge of complications has improved (except for reduced foetal movement and lower abdominal pain) over the years at a higher rate in the project area than the comparison area.
Impact Evaluation Surveys in Dhaka Urban Slums 2007, 2009 and 2011 22
Although knowledge about life-threatening maternal complications during pregnancy is not very common, knowledge about place of treatment for such conditions is found very high and shows some changes over years within the areas. Very few women mentioned home or pharmacy as place of treatment. The most common place for treatment in the project and the comparison areas in 2011 was government hospitals (59% and 69% respectively), followed by private clinics (30% and 33% respectively) and NGO health centre (18% and 21% respectively). In the project area, BRAC delivery hut was opted by 30% of the women in 2011 compared to 13% in 2009 and 2% in 2007. Relative frequency of mentioning NGO health centres gradually declined in either area over the years. The most common source of knowledge of information on pregnancy care in 2011 was ‘own experience' (53% in the project area and 57% in the comparison area), followed by ‘BRAC staff' (47% in the project area and 6% in the comparison area), ‘friends' (6% in the project areas and 10% in the comparison areas), and ‘family members' (9% in the project area and 15% in the comparison area). BRAC staff was mentioned more often in 2011 and 2009 compared to 2007 in the project area than in the comparison area.
Impact Evaluation Surveys in Dhaka Urban Slums 2007, 2009 and 2011 23
Table 4.1.3. Percent distribution of women by knowledge about complications during
pregnancy, place for treatment, and sources of information in Dhaka urban slums, 2007, 2009, and 2011
Project area
Comparison area
Area of knowledge
Complications that require medical treatment1
Reduced/absent foetal
movement High blood pressure
Oedema in hands/feet
Vaginal bleeding
Abortion/miscarriage 3.4
Lower abdominal pain
Place of treatment for pregnancy complications
BRAC delivery hut
Government hospital
Private clinic/chamber
NGO health centre
Sources of information on pregnancy care
Sebika/Kormi NGO clinic/worker
Health assistant (government)
100.0 100.0 100.0 100.0 100.0 100.0
1,256 2,172 2,268 1,227 1,054 1,129
1Multiple responses
Table 4.1.4 presents the percent distribution of women by knowledge of complications/illnesses during delivery as well as within 42 days of delivery that require medical treatment and area in 2007, 2009, and 2011. Women's overall knowledge about life-threatening post-delivery complications improved (except for prolonged labour, hand/feet prolapse, and severe abdominal pain) over the years, and the rate of improvement was higher
Impact Evaluation Surveys in Dhaka Urban Slums 2007, 2009 and 2011 24
in the project area than in the comparison area. In 2011 more women in the project area than the comparison area reported complications, such as excessive vaginal bleeding (67% versus 60%), convulsions (48% versus 32%), hand/feet prolapse (29% versus 23%), and prolonged labour (26% versus 22%).
Women's knowledge about where to go for treatment of life-threatening maternal conditions during or after 42 days of delivery was very high in either area in 2007, 2009, and 2011. Very few women (1%) mentioned ‘home' for managing such complications. Most frequently-mentioned places of treatment were government facilities (hospitals, maternity centre, and health and family welfare centres), followed by private clinics (including chamber) and NGO health centres in both areas each year.
Table 4.1.4. Percent distribution of women by knowledge about complications during and
after delivery in Dhaka urban slums, 2007, 2009, and 2011
Knowledge on complications
Project area
Comparison area
and treatment
2007 2009 2011 2007 2009 2011
Complications that require medical treatment1
Excessive vaginal bleeding
58.7 45.4 26.3 47.8 42.9 21.7
28.5 32.3 29.2 26.0 26.9 22.7
1.6 2.0 3.0 1.9 3.2 3.7
5.7 10.6 12.3 9.1 12.1 11.2
0.2 0.7 0.4 0.3 0.5 0.6
17.0 19.1 22.4 12.7 19.0 24.4
Severe abdominal pain
28.8 42.2 48.5 28.8 40.0 32.2
1.0 1.4 1.5 0.8 1.2 2.7
6.8 7.5 13.2 5.2 10.3 11.0
0.1 0.1 0.0 0.2 0.3 0.1
Place of treatment for complications during and after elivery1
0.8 0.5 0.1 0.6 1.5 0.4
Government hospital/health and family
74.5 72.8 76.7 64.5 79.6 79.6
welfare centre/maternity centre Private
29.8 60.1 32.4 40.0 47.1 33.8
34.2 35.3 24.4 32.1 32.8 16.3
100.0 100.0 100.0 100.0 100.0 100.0
1,256 2,172 2,269 1,227 1,054 1,129
1Multiple responses
4.2 Mother's Knowledge on Newborn and Childcare
The three surveys collected data on maternal knowledge about serious health problems during
the first week after birth that could endanger the life of a newborn in Dhaka urban slums in
2007, 2009, and 2011. The results are presented in Table 4.2.1. Knowledge about newborn's
life-threatening health problems in each area exhibits no consistent patterns of change over
the years. The overall difference in prevalence of knowledge between the two areas was quite
small, except for jaundice and convulsion. Health problems mentioned more by mothers in
Impact Evaluation Surveys in Dhaka Urban Slums 2007, 2009 and 2011 25
2011 were: difficult and fast breathing (range 65-70%), followed by asphyxia (48-49%), jaundice (27-39%), and convulsion (30-37%) in the project and the comparison area.
Mothers were asked about place of treatment for newborn's health problems. Common places of treatment mothers reported were: government hospital (including maternal and child welfare centres and the health and family welfare centres), followed by private clinics (including doctor's chamber), and NGO health centres in each area and year. Frequency of reporting NGO health centres reduced over the years in either area.
Table 4.2.1. Percent distribution of mothers by knowledge about life-threatening health
problems of newborns during the first week after birth and place for treatment in Dhaka
urban slums, 2007, 2009, and 2011
Knowledge of health
Project area
Comparison area
problems and treatment
Newborn's serious health problem1
Difficult or fast breathing
64.8 61.0 49.1 57.0 58.3 48.3
Reduction in food intake
Poor sucking of breast-milk
25.6 40.6 39.5 28.8 36.7 26.7
Skin rash/pustule
Infection in umbilical cord
Discharge from eyes
1.6 4.2 2.6 2.4 3.2 4.0
Swelling of head scalp
27.7 32.9 36.9 29.7 33.7 30.2
8.9 6.4 3.0 5.9 9.2 3.5
Excessive vomiting and swelling in
7.8 12.1 10.2 11.4 12.2 10.0
0.6 0.4 0.1 0.5 0.4 0.1
Place of treatment for newborn's health problems1
0.6 0.8 0.3 0.7 2.3 0.8
77.5 80.8 78.3 80.5 81.7 78.3
31.0 58.6 42.2 37.0 45.8 41.7
23.2 27.0 16.2 23.1 25.1 11.3
100.0 100.0 100.0
1,256 2,172 2,268 1,227 1,054 1,129
1Multiple responses were allowed
Table 4.2.2 presents the percent distribution of mother's knowledge relating to newborn care immediately after birth in Dhaka urban slums in 2007, 2009, and 2011. Their knowledge relating to drying newborn thoroughly, wrapping with warm clothes and feeding colostrum immediately after birth was higher but not universal in the project area than in the comparison area in 2011. Two in five mothers in the project area and half of the mothers in the comparison area did not know that newborns need wrapping with warm clothes and feeding colostrum immediately after birth. Knowledge about cord-care reduced in both areas
Impact Evaluation Surveys in Dhaka Urban Slums 2007, 2009 and 2011 26
over time. Mothers' knowledge about requirement of vaccination right after birth and requirement of vitamin A for under-five children, is universal in either area over the years.
Table 4.2.2. Percent distribution of mothers by essential newborn and childcare practices
known to them in Dhaka urban slums, 2007, 2009 and 2011
Knowledge on newborn
Project area
Comparison area
and childcare
2007 2009 2011 2007 2009 2011
Essential newborn care immediately after birth1
64.4 91.5 81.9 67.6 88.6 77.3
Wrapping with warm clothes
25.4 42.0 57.8 32.0 31.6 50.0
46.5 22.3 18.6 38.5 23.1 8.8
0.9 0.5 3.3 1.2 0.6 3.9
0.4 0.0 0.0 0.7 0.0 0.0
0.0 0.1 0.0 0.1 0.3 0.2
Requirement of vaccination right after birth
0.1 0.1 0.0 0.0 0.2 0.1
0.1 0.1 0.0 0.0 0.1 0.0
Requirement of vitamin A for under-five children
95.9 95.6 98.6 96.4 91.7 97.3
1.7 2.0 0.5 1.1 3.5 1.6
2.5 2.4 0.9 2.4 4.7 1.2
100.0 100.0 100.0 100.0
Total number
2,268 1,227 1,054 1,129
1Multiple responses
Table 4.2.3 presents the percent distribution of mothers by knowledge about newborn and
child-feeding practices and area in 2007, 2009, and 2011. A substantial improvement was
found in mother's knowledge about newborn's first feeding. In the project area, 82%
mentioned colostrums as the first feed in 2011 opposed to 39% in 2007 and it was 71% in the
comparison area in 2011 compared to 48% in 2007. On the other hand, there was a
substantial decrease in the use of honey as pre-lacteal feed from 49% in 2007 to 14% in 2011
in the project area. In the comparison area, it decreased from 39% in 2007 to 24% in 2011.
Fewer mothers mentioned sugar-water (2-3%) in 2011 compared to 8-9% in 2007 in either
area. Use of mustard oil was low, around 2%.
Mother's knowledge about time of initiation of breastfeeding was found to be very high in
either area over the years. Knowledge of breastfeeding ‘just after birth' increased from 52-
54% in 2007 to 61% in 2011 in each area while knowledge ‘within 24 hours of birth' did not
change; 38% in 2007 and 37% in 2011 in either area.
Impact Evaluation Surveys in Dhaka Urban Slums 2007, 2009 and 2011 27
Table 4.2.3. Percent distribution of mothers by knowledge about newborn and child-
feeding practices in Dhaka urban slums, 2007, 2009, and 2011
Knowledge about newborn and
Project area
Comparison area
child feeding
2007 2009 2011 2007 2009 2011
Newborn's first feeding1
Misri/sugar-water 7.7
Any milk except breast-milk
Initiation of breastfeeding
Just after birth
<24 hours of birth
Duration of exclusive breastfeeding
0.6 0.2 0.0 0.9 0.5 0.0
More than 6 months
Supplementary foods for child after exclusive breastfeeding3
Any milk except breast-milk
Suji (wheat particles)
Khichuri (rice, pulse, and vegetables
10.4 92.1 89.7 6.4 88.0 88.1
cooked with oil) Other liquid foods
Rice/chapatti 1.6
Leaves/vegetables 8.9
100.0 100.0 100.0
Total number
2,172 2,268
1Food/liquid that should put first in baby's mouth, 2Includes ‘don't know', 3Multiple responses possible
Knowledge about correct duration of exclusive breastfeeding 6-months has improved from 73% in 2007 to 96% in 2011 in the project area; and from 68% in 2007 to 91% in 2011 in the comparison area. Mothers were asked about complementary foods that should be given along
Impact Evaluation Surveys in Dhaka Urban Slums 2007, 2009 and 2011 28
with breast-milk to the baby after 6 months of age. Mother's knowledge underwent some changes in either area over the years. Relative frequency of reporting complementary foods, such as milk (other than breast-milk); suji (made of wheat particles), pulses and biscuit decreased with an increase in frequency of reporting egg, fish/meat, khichuri (made of rice, pulses, and vegetables cooked with edible oil), vegetables and fruits over the years. Complementary food items mothers more frequently mentioned in 2011 were khichuri (88-90%), any milk (45-53%), suji (48-52%), leaves and vegetables (44-49%), eggs (32-38%), fruits (23-34%) and fish and meat (18-27%).
Table 4.2.4. Percent distribution of mothers by knowledge about children's morbidity and
management practices in Dhaka urban slums, 2007, 2009, and 2011
Knowledge about children's morbidity
Project area
Comparison area
and place of treatment
2007 2009 2011 2007 2009 2011
Signs of pneumonia among under-five children1
Difficulty in breathing
Chest in-drawing 33.8
Acute respiratory infection (ARI)
Type of food should be given to under-five children with diarrhoea1
Home-made saline
Other liquid food/others
Amount of food should be given to under-five children with diarrhoea
Less food than usual
More food than usual
Person to seek advice to manage pneumonia/diarrhoea1
BRAC Shasthya Sebika 0.3
Medical assistant/sub-assistant community
medical officer (MA/SACMO)
22.4 10.5 7.6 23.4 21.2 8.0
Nurse/midwife/family welfare visitor
29.9 10.8 4.9 27.8 13.4 5.1
Nurse/midwife/family welfare visitor
8.4 13.4 3.3 10.0 14.3 3.1
Qualified doctor
Spiritual healers
Kabiraj/Hekim 0.1
100.0 100.0 100.0 100.0
Total number
2,268 1,227 1,054 1,129
1Multiple responses were possible
Impact Evaluation Surveys in Dhaka Urban Slums 2007, 2009 and 2011 29
Mothers are asked about signs and symptoms of pneumonia in under-five children and place
of treatment, and the results are presented in the Table 4.2.4. Knowledge of symptoms of
acute respiratory infection (ARI refers to cough with rapid or difficult breathing which was
chest-related is considered a proxy for pneumonia) did not improve in either area over the
years. Two in every five mothers (41% in the project area and 40% in the comparison area in
2007, and 37% in the project area and 42% in the comparison area in 2011) had knowledge
on the signs and symptoms of ARI.
Mother's knowledge about giving packet oral saline to children suffering from diarrhoea was
universal in either area over the years. Their knowledge relating to amount of food that
should be given to under-five children with diarrhoea was found to be high, but one in five
mothers mentioned ‘less food than usual' in either area. To manage diarrhoea and pneumonia
among under-five children, qualified doctor was the most preferred healthcare provider (61%
in 2007 and 87% in 2011 in the project area. In the comparison area, it was 58% in 2007 and
83% in 2011). Preference for paramedics (such as MA/SACMO or nurse/midwife/family
welfare visitor) declined from 22-23% in 2007 to 5-8% in 2011 in the project area. In the
comparison area, it declined from 23-28% in 2007 to 5-8% in 2011. Very few mothers (<6%)
mentioned BRAC Shashthya Sebika for treatment of pneumonia or diarrhoea in the project
area in 2011.
4.3 Pregnancy Planning
Table 4.3.1 presents percent distribution of women living in Dhaka urban slums by the
knowledge on pregnancy planning prior to pregnancy or child birth in 2007, 2009 and 2011.
Only 9% of the women in the project area and 20% in the comparison area have not had a
plan regarding place of delivery beforehand in 2011. Preference for home as a place of
delivery declined at a faster rate in the project area (from 85% in 2007 to 45% in 2011) than
in the comparison area (from 76% in 2007 to 62% in 2011) over the years. In the project area,
more women mentioned BRAC delivery hut for delivery in 2011 than in 2007. In the
comparison area, institution in plan for delivery was the government hospital (7-8%),
followed by private clinics and NGO health centre.
Impact Evaluation Surveys in Dhaka Urban Slums 2007, 2009 and 2011 30
Table 4.3.1. Percent distribution of women by pregnancy planning prior to
pregnancy/childbirth in Dhaka urban slums , 2007, 2009, and 2011
Project area
Comparison area
Pregnancy planning
2007 2009 2011 2007 2009 2011
Made plans regarding place of delivery
Type of place planned
Did not have any plan
BRAC delivery hut
Government hospital
Private clinic/chamber
NGO health centre
Made plan regarding assistance during delivery
Assistance during delivery
Did not have any plan
Relative/neighbour 54.8
Nurse/midwife/FWV
2.2 1.6 1.9 2.1 1.7 1.4
(government)2 Nurse/midwife/FWV (NGO)
Qualified doctor
Saved money to bear expenses relating to childbirth
Total number
1Sub-assistant community medical officer/Medical assistant; 2Family welfare visitor
One in five women did not have any plan regarding assistance during delivery in either area over the years. A shift in choice of assistance took place in the project area and also in the comparison area to a lesser extent. Choice for relative or neighbour and untrained TBA declined more in the project area than in the comparison area over the years. In the project area, trained TBAs were the choice of more women in 2011 compared to 2007. Three in every four women in either area practised saving money to bear extra expenses relating to childbirth in either area. The percentage of women who saved for delivery was higher and increased more in the project area than the comparison area.
Impact Evaluation Surveys in Dhaka Urban Slums 2007, 2009 and 2011 31
CHAPTER 5: PRACTICES RELATING TO MATERNAL AND
NEWBORN'S HEALTH
In response to Millennium Development Goal 4 and 5 and to meet the needs of women and infants, the Government of Bangladesh wants to increase skilled delivery attendance and post-delivery care up to 50% by 2015. The likelihood of receiving maternal health services decreases with increase in mother's age and birth-order, and increases with increase in the level of education and household asset quintile. This chapter presents findings from three surveys undertaken in 2007, 2009, and 2011 on the practices relating to antenatal care (ANC), place of delivery, delivery assistance, and postnatal care (PNC) for mothers and newborns living in Dhaka urban slums during 2007-2011.
5.1 Maternity care and services received
Antenatal care
Pregnancy is an important stage of a woman's life and has the potential to influence the
growing foetus and the mother's health. Adequacy of prenatal care has been defined by the
number of visits, the stage of pregnancy at which care is initiated, the source of care (private
versus public), the spacing of visits, and medical care services, for example, blood and urine
tests and blood pressure check-up, and health education. Antenatal care from a medically-
trained provider reduces health risks for both mother and child during pregnancy and
delivery. The Bangladesh maternal health strategy recommends at least four antenatal care
visits during pregnancy: the first, when the woman realizes she is pregnant; the second,
between the fourth and fifth month of pregnancy; the third, between the sixth and seventh
month; and the fourth at the ninth month. Mothers who delayed initiation of care until the
third trimester are likely to have a higher risk of low birth weight of their babies. The past
decade has seen substantial progress, nationally, in increasing the proportion of pregnant
women making at least one visit and in raising the total number of visits.
Figure 5.1.1. Percentage of women with ANC visit by area and year
ANC coverage increased in the project area by 18% points in 2011 from 75% in 2007 compared to increase by 1% point in 2011 from 81% in 2007 in the comparison area
Impact Evaluation Surveys in Dhaka Urban Slums 2007, 2009 and 2011 32
Table 5.1.1 presents the distribution of women by ANC visit, timing of first visit, and place of last ANC visit for live births in the last one year in Dhaka urban slums in 2007, 2009, and 2011. The overall coverage of ANC visits for the most recent birth increased from 75% in 2007 to 93% in 2011 in the project area compared to no increase (81% in 2007 and 2011) in the comparison area (Figure 5.1.1).
Table 5.1.1. Percent distribution of women who gave live births in the last one year by any
ANC visit for the most recent pregnancy and residence status in Dhaka urban slums, 2007,
2009, and 2011
Project area
Comparison area BUHS
Residence status
2007 2009 2011 2007 2009 2011
Duration of residence in enumeration slum
86.4 75.5 67.6 74.5
90.7 83.2 68.7 86.0
94.4 82.4 72.4 81.8
Place of previous residence
Dhaka urban area
95.1 83.2 75.9 80.3
Other urban area
92.6 66.7 73.7 83.0
90.5 79.0 64.0 81.6
70.7 81.5
Total number
Slum-dwellers in urban areas are usually poor, but all poor do not live in slums (2006 UHS). Jobs of slum-dwellers are temporary in nature. They change their jobs as well as residence more often compared to non-slum dwellers. Shift in residence to the non-project areas can affect exposure and access to maternal and child health services that are provided by the Manoshi's project. Women were asked about duration of residence in the enumeration slums till the survey date and location of previous residence. Duration of residence is categorized into three groups: <1 year, 1-2 year(s) and 3+ years; and location of previous residence into Dhaka urban area, other urban area, and rural area. As expected, duration of residence in enumeration slum is positively associated with any ANC visit in either area in each survey. In 2011, any ANC visit for the most recent birth in the project area was 86% among women who lived <1 year, 91% among women who lived 1-2 year(s), and 94% among women who lived 3 +years or always. Respective figures in the comparison area were 74%, 86% and 82%. Women's previous place of residence did not show any systematic difference in the coverage of any ANC visit in either area.
Impact Evaluation Surveys in Dhaka Urban Slums 2007, 2009 and 2011 33
Table 5.1.2. Percent distribution of women with live births in the last one year by number,
timing, and place for ANC visit for the most recent pregnancy in Dhaka urban slums, 2007, 2009, and 2011
Number and timing of
Project area
Comparison area
ANC visits and mean
number of visits
Number of ANC visits
Mean number of visits
2.24 2.95 3.03 2.39 2.69 2.43
per woman
Number of months pregnant at the time of first ANC visit
Mean months pregnant at
4.42 4.33 4.37 4.19 4.21 4.37
first visit
Place of last ANC visit
BRAC delivery hut
Government hospital
Private clinic/chamber
NGO health centre
Total number
‘-' is for not available The government recommends four or more ANC visits during pregnancy. Coverage of 4+ ANC
visits increased from 27% in 2007 to 52% in 2011 in the project area compared to no increase in
the comparison area between 2007 and 2011 (Table 5.1.2). The average number of ANC visits
also showed gradual increase between 2007 and 2011 in the project area, but it was not the case
in the comparison area. Average months pregnant at the first ANC visit centred around 4.3
months in either area over the years. For the last ANC visit, the use of BRAC delivery hut and
private clinic (including doctor's chamber) increased in the project area but not in the comparison
area over the years. While utilization of NGO health centres decreased in both areas over the
years, utilization of government hospitals increased, but little in the comparison area.
Equality in 4+ ANC visits
Slum-dwellers are of low income but differ in education, skills, and earnings. Women are of
different ages, birth-orders, education levels (measured with class passed), and economic
conditions (measured by asset quintile). These biosocial variables influence the use of
Impact Evaluation Surveys in Dhaka Urban Slums 2007, 2009 and 2011 34
maternal health services in slum and non-slum populations (BDHS 2007). Associations of these biosocial variables with coverage of 4 or more ANC visits are examined across years within the area and are presented in Table 5.1.3. Coverage of 4+ANC visits was higher for mothers with first-order birth than for mothers with four or higher-order births; for women with secondary education than for women with no education; and for mothers of the least poor households than for mothers of the poorest households in either area. Interestingly, the gaps between sub-groups of birth-order, education, and asset quintiles tended to become narrower in the project area but not in the comparison area over the years.
Table 5.1.3. Percent distribution of women who gave live births in the last one year and
had 4+ ANC visits for the most recent pregnancy by parity, education, and household asset quintile in Dhaka urban slums, 2007, 2009, and 2011
Parity, education, and
Project area
Comparison area
asset quintile
2007 2009 2011 2007 2009 2011
Birth-order
30.2 45.9 53.0 38.8 43.9 46.7
18.6 41.1 53.4 28.2 30.4 31.8
8.9 22.9 30.4 20.0 17.2 14.5
Ratio (order 4+ to 1)
Level of education of mothers (class passed)
20.1 30.7 38.2 17.5 23.3 21.7
Primary (class I-V)
Secondary (class VI+)
Ratio (secondary to
2.3 1.8 1.6 3.3 2.2 2.2
none)
Household asset quintile
19.0 25.0 39.1 16.6 17.3 19.2
23.2 28.8 36.7 25.8 32.1 23.8
32.5 44.5 47.7 37.8 33.6 34.6
33.8 47.4 52.0 49.2 42.4 49.6
58.1 57.1 70.2 60.6 58.8 47.3
Ratio (least poor to
3.1 2.3 1.8 3.7 3.4 2.5
poorest)
Total number
Pace of increase in the coverage of 4+ ANC visits over the years and reduction in social and economic inequalities are estimated undertaking logistic regression analysis separately for the project and the comparison areas. Table 5.1.4 shows the adjusted and unadjusted coverage for different categories of the variables considered in each area. The odds ratio shows the relative difference between categories within the area. Pace of increase (indicated by the odds ratio) in coverage has been higher in the project area than in the comparison area, possibly due to the Manoshi's project. The effect of longer durations relative to short duration (<1 year) of living in the enumeration slum on coverage of 4+ ANC visits was lower in the project area than in the comparison area. Coverage of 4+ ANC visits was much lower in four- or higher-order births compared to births of first order in either area. The odds ratio of receiving 4+ ANC visits among women with secondary or higher education compared to women with no
Impact Evaluation Surveys in Dhaka Urban Slums 2007, 2009 and 2011 35
education was 1.78 times higher in the project area, and it was 2.56 times higher in the comparison area. The gap between asset quintiles was much larger in the comparison area than in the project area; for example, the odds ratio of receiving 4+ ANC visits among women belonging to the least poor quintile compared to women belonging to the poorest quintile was 2.76 times higher in the project area and 4.56 times higher in the comparison area. Such a large reduction in inequalities in the project area compared to the comparison area could be due to the Manoshi's project activities. Table 5.1.5 presents the percent distribution of women by services and messages received
Table 5.1.4. Demographic and socioeconomic variables associated with women's 4+ ANC
visits for the most recent pregnancy in the last one year in Dhaka urban slums, 2007, 2009,
and 2011
Project area
Comparison area
Demographic and
Odds ratioa (95% CI)
Odds ratioa (95% CI)
variable
1.63** (1.26-2.09)
1.44* (1.09-1.90)
2.47** (1.90-3.19)
1.43* (1.06-1.95)
Duration of
residence (yr)
1.13 (0.89-1.44)
1.25 (0.88-1.76)
1.26* (1.00-1.60)
1.32 (0.97-1.81)
Birth-order
0.87 (0.72-1.05)
0.65** (0.81-0.84)
0.42** (0.30-.58)
0.35** (0.20-0.61)
Highest educational level
1.68** (0.96-1.42)
1.58** (1.17-2.15)
1.78** (1.42-2.23)
2.56** (2.03-3.23)
Asset quintile
0.96 (0.77-1.20)
1.69** (1.14-2.50)
1.54** (1.22-1.94)
2.19** (1.45-3.31)
1.82** (1.35-2.46)
3.13** (2.09-4.70)
2.76** (2.09-3.66)
4.56** (2.86-7.25)
42.1 35.6
226.1, p<0.001
s258.9, p<0.001
a) All odds ratios are adjusted for clustering of maternity care to women of the same clusters and for all other variables The dependent variable was coded 1 if women made 4+ANC visits, otherwise coded 0. *p<0.05, **p<0.01
during ANC visits for the most recent births in Dhaka urban slums in 2007, 2009, and 2011. The percentages of women who received different ANC services (except for height measurement and urine test) are higher in the project area than in the comparison area in
Impact Evaluation Surveys in Dhaka Urban Slums 2007, 2009 and 2011 36
2011. ANC services that are more frequently used in these two areas in 2011 were: examination of the abdomen (70% versus 52% respectively), measurement of weight (67% versus 59% respectively), and measurement of blood pressure (62% versus 38% respectively). Invasive diagnostic services they used more often were: blood and urine tests and ultrasonography (23%, 21%, and 34% respectively in the project area, and 17%, 21%, and 26% respectively in the comparison area) with higher frequency in the project area in 2011 than in 2007 (11%, 18%, and 15% respectively) and in the comparison area in 2011.
Table 5.1.5. Percent distribution of women who gave live births in the last one year by
services and messages received during ANC visits for the most recent pregnancy in Dhaka urban slums, 2007, 2009, and 2011
Services and messages
Project area
Comparison area
received during ANC visit
2007 2009 2011 2007 2009 2011
Services received during ANC visitsa
No ANC visit
1.3 17.2 10.7 1.0 15.7 19.0 35.6
Blood pressure measured
Abdomen examined
0.7 4.0 2.3 1.6 2.2 2.1 -
Iron supplementation
Messages received during ANC visitsa
No ANC visit
0.1 1.0 0.9 0.2 0.6 0.9
Danger signs of pregnancy
2.7 9.8 5.0 4.9 8.8 3.0
Danger signs of newborns
Essential newborn's care
Use of clean delivery kit
Iron supplementation
Vitamin A intake
Advice on proper diet
Advice to take rest
Advice on not to lift heavy items
43.0 44.2 49.0 46.1 40.9 31.3
Advice on regular check-ups
13.2 17.6 17.4 16.0 11.4 14.1
0.0 0.1 0.4 0.2 0.0 0.2
Total number
aMultiple responses were allowed
Impact Evaluation Surveys in Dhaka Urban Slums 2007, 2009 and 2011 37
During ANC visits, more women received advices (except for proper diet) in 2011 than in
2007 in either area with a difference between areas. Advices were more frequent in the
project area than in the comparison area. Advice most often received in both areas was on:
proper diets (72% versus 53%), followed by taking more rest (64% versus 46%), intake of
iron supplementation (39% versus 29%) and not to lift heavy items (49% versus 31%).
Delivery care
Proper medical care and hygienic conditions during delivery can reduce the risk of
complications and infections that may cause death of the mother and the baby. Hence, it is
important to increase the proportion of births delivered in a safe and clean environment and
under supervision of health professionals. Table 5.1.6 presents the percent distribution of
women by place of delivery by duration of living in the enumeration slum and previous place
of living in Dhaka urban slums in 2007, 2009, and 2011. There has been a change in place of
delivery; the percentage of institutional delivery increased at a faster rate (from 15% in 2007
to 59% in 2011) in the project area than the comparison area (from 25% in 2007 to 28% in
2011) over the same period (Figure 5.2). Major types of institutions in either area are:
government hospitals, private clinics, and NGO health centres. In the project area, BRAC
delivery hut emerged as a common place for delivery over the years. For delivering baby in
2011, 23% of women used BRAC delivery hut, followed by government hospital and private
clinic/chamber (14% each) in the project area compared to 14% in government hospitals,
followed by private clinic/chamber (7%) in the comparison area in 2011.
Figure 5.2: Percentage of institutional delivery by area and year
Institutional delivery increased by 44% points in 2011 from 15% points in 2007 in the project area opposed to increase by 3% points in 2011 from 25% points in 2007 in the comparison area
Impact Evaluation Surveys in Dhaka Urban Slums 2007, 2009 and 2011 38
Table 5.1.6. Percent distribution of women by residence status and place of delivery with live births
in the last one year in Dhaka urban slums, 2007, 2009, and 2011
Project area
Comparison area
Place of delivery of last live birth
2007 2009 2011 2007 2009 2011
85.1 49.9 40.8 75.2 75.6 72.4 87.6
delivery
14.9 50.1 59.2 24.8 24.4 27.6 12.4
5.8 11.7 14.3 7.4 11.2 13.9 6.8
BRAC delivery hut
2.5 15.1 14.6 9.0 6.7 7.1 5.5
4.6 3.7 7.1 8.3 3.5 3.6
0.7 0.4 0.1 0.2 0.0 0.0 0.1
100.0 100.0 100.0 100.0 100.0 100.0
Duration of residence in enumeration slum ------- % of institutional delivery
15.1 38.3 49.6 22.7 22.5 25.5
11.8 46.0 53.7 27.7 18.8 29.5
16.1 54.0 62.2 24.7 27.0 27.7
Place of previous residence
14.8 55.9 68.8 27.7 33.9 34.4
14.3 54.4 55.6 26.7 17.5 22.7
15.2 42.8 51.7 20.6 15.3 23.8
Total number
1,013 1,136
Duration of residence in the enumeration slum is positively associated with institutional
delivery in the project area, but not in the comparison area. In 2011, the percentage of
institutional delivery in the project area was the highest, 62% among women who have been
living in current slums for three or more years, followed by 54 percent among by women
living for 1-2 year(s) and 50% among women living for less than one year. Previous place of
living, a proxy for migration status, also influenced the percentage of institutional delivery.
For example, the percentage of institutional deliveries was the lowest among women who
migrated to Dhaka urban slums from rural areas (52 percent), followed by women who
migrated from other urban areas (56%) and women who have always been living in Dhaka
urban areas (69%) in the project area in 2011. The respective figures in the comparison area
are 24%, 23%, and 34%.
Equity in Institutional Delivery
Differentials in institutional delivery by women's parity, education, and household asset
quintiles are estimated across years within each area (Table 5.1.7). The percentage of
institutional delivery has been higher for the first-order births than for four or higher-order
births; for women with secondary or more education than for women with no education; and
Impact Evaluation Surveys in Dhaka Urban Slums 2007, 2009 and 2011 39
for women from the least poor households than for women from the poorest households in either area. Interestingly, the differentials reduced more in the project area than in the comparison area over the years. For example, the ratios of the percentage of institutional delivery in women with secondary education (or women of least poor households) to the percentage of women with no education (or women of the poorest households) tend to be narrower in the project area than in the comparison area over the years.
Table 5.1.7. Percent distribution of women who had institutional delivery with live births
in the last one year by parity, level of education, and asset score in Dhaka urban slums, 2007, 2009, and 2011
Demographic and
Project area and year
Comparison area and year
socioeconomic variable
2007 2009 2011 2007 2009 2011
Parity of women
Ratio (4+ to 1)
Women's education (class passed)
None 11.6
Primary (class I-V)
Secondary (class 6+)
Ratio (secondary to
2.3 1.5 1.3 3.9 2.4 2.8
none)
Household asset quintile
Ratio (Least poor to
4.1 1.8 1.8 4.2 3.4 3.2
poorest)
Total %
672 1,013 1,136 612 536 562
Rate of increase in institutional delivery over the years and reduction in inequalities between
different categories of the biosocial variables are estimated using logistic regression analysis.
Table 5.1.8 shows the unadjusted (in terms of percentage of institutional delivery) and
adjusted rate (in terms of odds ratio) between different categories of the same variables in
each area. The odds ratios of having an institutional delivery in 2009 and 2011 with reference
to 2007 are respectively 5 times and 7.2 times higher in the project area and 1.5 times and 1.7
times higher in the comparison area. Such high odds ratios in the project area are possible due
to the Manoshi's project activities. The effects of duration of living in the enumeration slum
and birth-order on institutional delivery are not big compared to the effects of level of
education and asset quintile in either area. The odds ratio of having an institutional delivery
among women with secondary education compared to women with no education was 1.6
times higher in the project area and 2.7 times higher in the comparison area. Similarly, the
odds ratio of having an institutional delivery among women belonging to the least poor
quintile compared to women belonging to the poorest quintile was 2.8 times higher in the
Impact Evaluation Surveys in Dhaka Urban Slums 2007, 2009 and 2011 40
project area and 4.3 times higher in the comparison area. Such large reductions in education
and economic inequalities in the project area compared to the comparison area could be due
to the interventions of the project.
Table 5.1.8. Demographic and socioeconomic variables associated with women's
institutional delivery with live births in the last one year in Dhaka urban slums,
2007, 2009, and 2011
Project area
Comparison area
Demographic and
socioeconomic variable
institutional Odds ratioa (& 95% CI)
Odds ratioa (& 95% CI)
Survey year
4.97** (3.56-6.96)
1.51 *(1.02-2.22)
6.27** (4.42-8.90)
1.60* (1.07-2.38)
Number of ANC visits
2.01** (1.33-3.02)
1.95** (1.32-2.89)
3.68** (2.51-5.41)
3.30** (2.13-5.11)
6.00** (4.02-8.93)
5.32** (3.82-7.41)
7.31** (4.36-12.3)
6.74** (3.84-11.8)
Duration of residence
0.92 (0.69-1.22)
0.80 (0.57-1.11)
1.25 (0.94-1.66)
0.91 (0.70-1.19)
Birth-order
0.95 (0.77-1.18)
0.89 (0.67-1.17)
0.55* (0.31-0.98)
Highest educational level
0.96 (0.78-1.18)
1.51* (1.03-2.23)
1.37** (1.08-1.73)
2.16** (1.49-3.11)
Asset quintile
1.11 (0.86-1.44)
1.12 (0.73-1.73)
1.24 (0.90 -1.73)
1.69* (1.09-2.62)
1.47** (1.11-1.95)
2.22** (1.49-3.30)
2.20** (1.59-3.04)
2.97** (1.92-4.59)
Wald Chi-square (12
533.0, p<0.001
310.3, p<0.001
aAll odds ratios are adjusted for clustering of maternity care to women of the same clusters and for all other variables. The dependent variable was coded 1 if women who delivered made any PNC visit, otherwise coded 0. *p<0.05, **p<0.01 Table 5.1.9 presents the percent distribution of women by assistance received during delivery and mode and procedure of delivery in Dhaka urban slums in 2007, 2009, and 2011. Distribution of delivery assistance women received during the most recent childbirth changed over the years, and the change was larger in the project area than in the comparison area. As expected, the use of BRAC midwife increased, and that of trained and untrained TBA
Impact Evaluation Surveys in Dhaka Urban Slums 2007, 2009 and 2011 41
decreased over the years in the project area only. Use of qualified doctor for delivery increased in both areas over the years. In 2011, deliveries were assisted more frequently by qualified doctors (28%), followed by BRAC midwife (23%) and nurse/midwife/family welfare visitor (9%) in the project area than in the comparison area where deliveries were attended by qualified doctor (17%), followed by BRAC midwife (3%), and nurse/midwife/family welfare visitor (8%). The mode of deliveries changed at a faster rate in the project area than in the comparison area over the years. In the project area, caesarean-section increased from 6% in 2007 to 18% in 2009 and to 24% in 2011 whereas, in the comparison area, it increased from 11% in 2007 to 12% in 2009 and to 14% in 2011. The procedure used in delivery has also undergone some changes over time; the use of drip has gone down in both areas over the years. Use of injection and saline increased in the project area but not in the comparison area over the years.
Table 5.1.9. Percent distribution of women by assistance, mode and procedure in delivery
with live births in the last one year in Dhaka urban slums, 2007, 2009, and 2011
Project area
Comparison area
Assistance during delivery1
2007 2009 2011 2007 2009 2011
0.9 0.1 0.3 0.5 0.2 0.5 0.8
0.9 14.3 23.2 0.0 2.2 3.0
0.3 3.8 1.1 0.3 1.3 0.7 6.4
1.0 0.2 0.2 1.3 0.6 0.2
Nurse/midwife/family welfare
4.8 9.8 9.2 9.8 7.6 8.0
visitor Qualified
7.6 21.7 28.4 14.2 14.0 17.4 11.4
0.1 0.0 0.1 0.0 0.0 0.0
Relative/neighbour
6.3 2.4 1.1 8.3 2.4 2.8 11.2
58.0 29.6 22.9 44.0 43.1 42.2 53.7
20.1 18.1 13.6 21.6 28.5 25.1 16.2
Mode of delivery
92.3 78.6 74.8 85.1 84.3 85.1
Assisted delivery (vacuum,
1.6 3.4 1.1 3.6 3.5 0.7
forceps, etc) Caesarean-section
6.1 18.1 24.0 11.3 12.1 14.2
Procedures used in delivery2
28.9 34.8 40.2 40.8 32.8 40.4
27.2 39.0 41.3 37.4 33.0 35.2
15.2 15.5 6.8 23.2 16.4 8.9
3.0 4.1 3.2 8.5 4.3 2.7
1.8 1.1 0.3 7.8 1.7 1.4
100.0 100.0 100.0 100.0 100.0 100.0
Total number
1,013 1,136
1The person who actually caught the baby; 2Multiple responses; 3medical assistant/sub-assistant community medical officer
Impact Evaluation Surveys in Dhaka Urban Slums 2007, 2009 and 2011 42
Caesarean-section delivery
The percentage of births by caesarean-section (C-section) is often considered a proxy for women's access to skilled care for complicated deliveries. Table 5.1.10 shows the percentage of live births in the last one year delivered by C-section for socioeconomic variables. Delivery by C-section increased in the project area over the years in than the comparison area. C-section was more frequent among women living in the enumeration slum for longer period than for shorter period; and among women with first-order births than for higher-order births. Education level and asset quintile were associated with C-section deliveries; in 2011, more than one-third of women in the project area, who had at least secondary education or who belonged to the least poor quintile delivered by C-section compared to 14% of women who had no education or 10% of women who belonged to the poorest quintile. In 2011, one-fourth of women in the comparison area, who had at least secondary education or who belonged to the least poor quintile delivered by C-section compared to 6% of women with no education or 4% of women who belonged to the poorest quintile. The gap in caesarean-section between the poorest and the least poor women decreased in the project area but not in the comparison area over the years.
Table 5.1.10. Percent distribution of women who had cesarean-section delivery with
live births in the last one year by duration of residence, parity, level of education, and asset quintile in Dhaka urban slums, 2007, 2009, and 2011
Duration of
Project area Comparison area
residence, parity,
level of education,
2007 2009 2011 2007 2009 2011
and asset score
Duration of residence (yr)
Ratio (4+ to 1) 0.6
Women's education (class passed)
Primary (class I-V) 4.1
Secondary (class 6+)
Ratio (secondary to
3.5 3.6 2.4 3.4 2.3 3.8
Household asset quintile
Ratio (Least poor to
6.8 5.3 3.8 8.9 4.5 7.2
poorest)
Total number
Impact Evaluation Surveys in Dhaka Urban Slums 2007, 2009 and 2011 43
As distributions of the women interviewed in three surveys by residence status, education,
and household possessions of durable assets are similar, some of the increases in the usage of
maternal health services may be due to differences in social and economic conditions, in
addition to the project effects. Logistic regression model is fitted to estimate the effects of the
variables, controlling simultaneously for other variables; the results are presented in Table
5.1.11. The odds ratios show an increase in C-section over the years in each area; and the
likelihood was higher in the project area than in the comparison area. The education
differential in C-section was comparable in both areas, but the economic (indicated by asset
quintile) differential was lower in the project area than in the comparison area.
Table 5.1.11. Demographic and socioeconomic variables associated with women's C-
section delivery with live births in the last one year in Dhaka urban slums, 2007, 2009, and 2011
Demographic
Project area
Comparison area
Odds ratioa (95% CI)
Odds ratioa (95% CI)
variable
Survey year
2.74** (1.91-3.94)
1.68* (1.07-2.64)
4.12** (2.72-6.23)
2.00 **(1.33-3.01)
Duration of residence (year)
0.88 (0.60-1.29)
0.77 (0.49-1.20)
1.19 (0.85-1.65)
1.03 (0.68-1.57)
Birth-order
0.68** (0.54-0.87)
0.75 (0.52-1.09)
0.66 (0.41-1.08)
0.37* (0.17-0.83)
Highest educational level
1.03 (0.78-1.35)
1.30 (0.89-1.91)
2.28** (1.76-2.96)
2.00* *(1.37-2.93)
Household asset quintile
1.27 (0.83-1.94)
1.67 (0.87-3.21)
2.03** (1.43-2.88)
2.77** (1.45-5.29)
2.58 ** (1.74-3.81)
4.59** (2.57-8.19)
4.43** (3.20-6.12)
6.29** (3.10-12.75)
Wald Chi-square
291.8, p<0.001
142.7, p<0.001
a) All odds ratios are adjusted for clustering of maternity care to women of the same clusters and for all other variables. The dependent variable was coded 1 if women who delivered in made any PNC visit, otherwise coded 0. *p<0.05, **p<0.01
Impact Evaluation Surveys in Dhaka Urban Slums 2007, 2009 and 2011 44
C-section delivery opens scopes for generating income, and the rate of C-section may be higher in private for-profit clinics than non-profit making clinics or hospitals. The Manoshi's project has signed an MOU (memorandum of understanding) with some public, private and NGO clinics or hospitals to refer pregnancy with complications for delivery services at negotiable rates. Table 5.1.12 shows the rate of C-sections deliveries by type of institution in each area in 2007, 2009, and 2011. Though the rate of C-section increased to a little extent among deliveries conducted in the government hospitals, the rate gradually increased at a higher rate in deliveries conducted in the private clinics in either area over the years. The rate of C-section in NGO health centres also increased at a rate lower than that in private clinic over the years in the project area but not in the comparison area.
Table 5.1.12. Percentage of normal and C-section deliveries by place of delivery with live births
in the last one year in Dhaka urban slums, 2007, 2009, and 2011
Project area
Normal C-section N Normal C-section N
Normal C-section N
Place of delivery
BRAC delivery hut
Government hospital
NGO health centre
Comparison area Normal C-section
N Normal C-section N
Normal C-section N
Place of delivery
BRAC delivery hut
hospital Private clinic
Figure 5.1.2 shows percentage of caesarean-section and vaginal delivery among institutional deliveries by type of institution in Dhaka urban slums in 2007, 2009, and 2011. About two-thirds of deliveries in private clinics were done through C-section compared to about half of deliveries in government hospitals have under gone through C-section in either area.
Impact Evaluation Surveys in Dhaka Urban Slums 2007, 2009 and 2011 45
Figure : 5.1.2 Percentage of caesarean-section and vaginal delivery among institutional
Out-of-Pocket Expenditure for Delivery
Pregnancy can become complicated anytime, and one needs to be prepared to face the
emergency. Preparation includes planning for place of delivery, contact with skilled birth
attendant to be present during delivery, and saving some money to pay extra expenses long
before the delivery. Women were asked about out-of-pocket expenditure they made for
delivery, assistance during delivery, delivery complications and medicine, transportation, and
others if any for delivery of the baby born in the last one year in 2007, 2009, and 2011. Table
5.1.13 shows the percentage of women who did not make out-of-pocket expenditure for
delivery by mode and place of delivery and by area and year. The overall percentage of
deliveries, costing no money, increased in 2009 and declined substantially in 2011 compared
to 2007 in either area. As expected, the percentage of deliveries with no out-of-pocket
expenditure was higher for normal deliveries at home than for normal deliveries at
institutions. A few cases of C-sections were performed in 2007 and also in 2009 with out-of-
pocket expenditure.
Table 5.1.13. Percent distribution of deliveries with live births in the last one year without
out-pocket expenditure by mode of delivery in Dhaka urban slums, 2007, 2009, and 2011
Mode and institute of
Project area
Comparison area
delivery
2007 2009 2011 2007 2009 2011
Normal delivery at home
40.7 54.1 14.0 29.6 44.9 8.1
Normal delivery at institution
17.0 38.2 15.5 3.6 7.6 1.3
Caesarean-section
2.4 3.3 0.0 5.9 0.0 0.0
Total number
Table 5.1.14 shows out-of-pocket expenditure for the women who delivered in the last one year by mode and place of delivery and by area and year. Mean and median of out-of-pocket expenditure for a normal (including assisted) delivery in a health facility increased over the years, and the rate of increase was higher in the project area than in the comparison area. Expenditure for caesarean-section increased two-folds in either area over the years.
Impact Evaluation Surveys in Dhaka Urban Slums 2007, 2009 and 2011 46
Table 5.1.14. Mean and median of out-of-pocket expenditure by mode of delivery with
live births in the last one year in Dhaka urban slums, 2007, 2009, and 2011
Project area
Comparison area
place of
delivery
2007 2009 2011 2007 2009 2011
Normal delivery at home
Mean
569 505 458 457 405 406
Normal delivery at institution
Mean
58 324 400 82 65 76
Caesarean-section
Mean
41 182 269 67 65 79
668 1011 1127 606 535 561
aExcluded cases with no out-of-pocket expenditure and very few cases with unknown out-of-pocket expenditure
Out-of-pocket expenditure for delivery care is disaggregated by type of institutions, and the results are presented in Table 5.1.15. As expected, expenditures for normal and C-section deliveries were the highest in a private clinic, followed by an NGO health centre and government hospital. Surprisingly, delivery expenditure in an NGO health centre and in a government hospital were comparable, though services in government hospitals were free of charge. Expenditure for normal (and possibly less complicated) delivery was the lowest in BRAC birthing huts compared to other institutions.
Impact Evaluation Surveys in Dhaka Urban Slums 2007, 2009 and 2011 47
Table 5.1.15. Average out-of-pocket expenditure by institution of delivery with live
births in the last one year in Dhaka urban slums, 2007, 2009, and 2011
Project area
Normal delivery at
BRAC delivery hut1
Government hospital
NGO health centre
C- section at
Government hospital
NGO health centre
Comparison area
Normal delivery at
BRAC delivery hut
Government hospital
NGO health centre
C-section at
Government hospital
NGO health centre
1BRAC delivery huts conduct less-complicated normal delivery and refer the complicated cases
The women were asked about sources of out-of-pocket expenditure they incurred for delivery of the baby born in the last one year in either area; the results are disaggregated by place of delivery, and presented in Table 5.1.16. The most common sources of money were: family fund and savings for delivery purpose for each type of delivery. Though three in four women saved money in advance to pay for delivery expenditure (Table 4.3.1), own saving was not the most frequent source. Use of family fund was more frequent for C-sections than for normal delivery in either area. The less common sources were borrowing money from relatives and non-relatives in either area.
Impact Evaluation Surveys in Dhaka Urban Slums 2007, 2009 and 2011 48
5.1.16. Percent distribution of women by source of out-of-pocket expenditure and mode and
place of delivery with live birth in the last one year in Dhaka urban slums, 2007, 2009, and 2011
Normal at home
Normal at institution
C-section
Source of
2007 2009 2011 2007 2009 2011 2007 2009 2011
Project area
delivery Family fund
sale/mortgage
aNumber of
deliveries with 572 505 464 59 325 401 41 183 271
out-of-pocket
expenditure
Comparison area
delivery Family-fund
sale/mortgage
aNumber of
deliveries with 460 405 407 84 66 76 68 65 79
out-of-pocket
expenditure
aExcluded cases with no out-of-pocket expenditure and very few cases with unknown out-of-pocket expenditure
Postnatal care
Postnatal care (PNC) is important for early detection and treatment of complications arising
from delivery, especially for births that occur at home. Postnatal check-ups also offer an
opportunity to counsel mothers on how to care for themselves and their newborns. In the past,
use of PNC in Bangladesh has not been as emphasized as antenatal care. As a result, the use-
rates of PNC have always been well below the use-rates of ANC. The PNC use-rates have
been rising slowly since the introduction of the maternal health strategy which encourages
use of PNC. It may be mentioned that there are cultural restrictions among the Hindus on
mothers and their new babies to remain in the house for the first forty days after delivery. If
enforced, this is obviously a barrier to early use of PNC as well as other services, such as
expanded project on immunization–EPI (for BCG in particular). In order to assess the extent
of PNC-use, every woman who has a birth in the last one year preceding the survey was
asked whether she or her child received any check-up after delivery and about residence
status; the results are presented in Table 5.1.17. The proportion receiving PNC among the
sampled women increased from 28% in 2007 to 55% in 2009 and to 66% in 2011 in the
project area. It was not the case in the comparison area where the proportion rather decreased
Impact Evaluation Surveys in Dhaka Urban Slums 2007, 2009 and 2011 49
from 40% in 2007 to 32% in 2009 and to 33% in 2011. Residence status, particularly long duration of living in enumeration slums was associated with increased access to PNC in the project area but not in the comparison area. In 2011, PNC in the project area was the highest—69% among women who was living in the enumeration slums for three or more years, followed by 61% among women living for 1-2 year(s), and 55% among women living for less than 1 year. It was not the case in the comparison area; the respective figures were 32%, 34%, and 37% in 2011. Women's previous place of living also influenced the coverage of PNC; it was the highest (75%) among women who had always been living in Dhaka urban slums, followed by 63% among women migrating from other urban areas and 59% among women migrating from rural areas. Figure 5.1: Percentage of women who received any PNC by area and year
Between 2007 and 2011, coverage of PNC visits increased by 36% points in the project area opposed to 9% points in the comparison area
Table 5.1.17. Percent distribution of women who had PNC visits with live births in the last
one year in Dhaka urban slums, 2007, 2009, and 2011
Project area
Comparison area
Residence status
2007 2009 2011 2007 2009 2011
Duration of residence in enumeration slum (year)
55.2 36.2 36.3 36.7
61.2 43.1 24.1 34.1
69.4 41.3 33.9 31.9
Place of previous residence
Dhaka urban area
Other urban area
Total number
Women were asked about number and place of PNC visits, and within how many days of delivery the check-up took place; the results are presented in Table 5.1.18. The percentage of women who received one PNC visit after delivery increased because of increase in institutional delivery over the years in the project area but not in the comparison area. There was an increase in percentage of women with second or third PNC visit in project area over the years. It rather decreased in the comparison area. On enquiry about number of days after delivery for PNC visits, more women, 62% received PNC on the same day (the day of the birth is also the day of receiving PNC) in the project area compared to 28% in the comparisons area in 2011.
Impact Evaluation Surveys in Dhaka Urban Slums 2007, 2009 and 2011 50
Percents distribution of the place of the first PNC visit shows some changes over the years within the areas. The use of BRAC delivery huts increased from 2% in 2007 to 19% in 2009 and to 24% in 2011 in the project area. While the use of government hospitals increased in both areas, the use of private clinics increased in the project area but decreased in the comparison area over the years. NGO health centre were used less frequently in either area over the years.
Table 5.1.18. Percent distribution of women by PNC visit with live births in the last one
year in Dhaka urban slums, 2007, 2009, and 2011
Number and timing of
Project area
Comparison area
PNC visits
2007 2009 2011 BUHS
Number of PNC visits
Number of days after delivery for PNC visit
2.1 1.3 1.6 1.5 1.3 0.9 13.7
8 days – 1 month
2.8 0.7 0.2 4.1 2.1 0.4 17.9
Place of first PNC visits
BRAC delivery hut
NGO health centre
Government hospital
Pharmacy/chamber
100.0 100.0 100.0
100.0 100.0
Total number
BUHS refers to 2006 Bangladesh Urban Health Survey
Equity in postnatal care
Differentials in PNC by parity, level of women's education, and household asset quintiles
were estimated across years within each area (Table 5.1.19). Percentage of receiving PNC
was higher for women with first parity than for women with four or higher parity, for women
with secondary education than women with no education, and for women of the least poor
households than women of the poorest households in either area. As expected the odds ratio
between different categories of parity, education, and asset quintiles tended to be lower in the
project area than in the comparison area over the years.
Impact Evaluation Surveys in Dhaka Urban Slums 2007, 2009 and 2011 51
Chances of receiving PNC over the years and reduction in inequalities between different categories of the same variables were estimated using logistic regression analysis; the results are presented in Table 5.1.19. The odds ratios of receiving PNC in 2009 and 2011 with reference to 2007 were 2.54 times and 4.05 times higher in the project area, and these are comparable in the comparison area. Such a difference was due to the Manoshi's project activities. Duration of living for three or more years compared to less than 1 year in the enumeration slum was associated with higher odds ratio of receiving PNC visit in the project area only. The odds ratio of receiving PNC visit was lower for higher-order births compared to the first-order births in the comparison area, and it was not the case in the project area. The odds ratio of receiving PNC among women with secondary education compared to women with no education was 1.68 times higher in the project area and 2.36 times higher in the comparison area. Similarly, the odds ratio of receiving PNC among women belonging to the least poor quintile compared to women belonging to the poorest quintile was 2.61 times higher in the project area and 3.72 times higher in the comparison area. Lower education and economic inequalities in the project area compared to the comparison area could be due to the interventions of the Manoshi's project.
Impact Evaluation Surveys in Dhaka Urban Slums 2007, 2009 and 2011 52
Table 5.1.19. Demographic and socioeconomic variables associated with women's PNC
for the most recent birth in Dhaka urban slums, 2007, 2009, and 2011
Demographic and
Project area
Comparison area
Odds Ratioa (95%
Odds Ratioa (95%
variable
Survey year
2.54** (1.99-3.39)
4.05**(2.99-5.49)
Duration of residence (year)
1.11 (0.86-1.42)
0.72 (0.52-1.01)
1.48** (1.14-1.91)
0.86 (0.66-1.12)
Birth order
0.97 (0.80-1.18)
0.78* (0.61-0.99)
0.80 (0.59-1.09)
0.52** (0.33-0.83)
Highest education level
1.05 (0.87-1.27)
1.49* (1.06-2.09)
1.68** (1.35-2.09)
2.36* (1.81-3.07)
Asset quintile
1.15 (0.93-1.43)
1.25 (0.91-1.73)
1.48** (1.13-1.95)
1.99** (1.43-2.76)
1.74** (1.36-2.23)
2.76** (2.03-3.75)
2.61** (2.00-3.42)
3.72** (2.55-5.43)
Wald Chi-square (23 df)
428.9, p<0.001
218.7, p<0.001
aAll odds ratios are adjusted for clustering of maternity care to women of the same clusters and for all other variables. The dependent variable was coded 1 if women made any PNC visit, otherwise coded 0. *p<0.05, **p<0.01
Trends and differentials in 4+ ANC visits, place of delivery, area
Logistic regression analysis was conducted to estimate differentials in 4+ ANC visits,
institutional delivery, and PNC visit by area, year, duration of residence in enumeration
slum, birth-order (parity), level of women's education and household asset quintiles,
controlling simultaneously for the effects of other variables (Table 5.1.20). The odds ratio of
receiving 4+ ANC visits was 1.2 times higher, an institutional delivery was 2.2 times higher,
and PNC was 2.0 times higher in the project area than in the comparison area. The use of
maternity services has gradually increased over the years, with rate of increase being higher
for institutional delivery, followed by PNC and 4+ ANC visits. Education and economic
differentials (measured with odds ratio) in 4+ ANC visits, institutional delivery, and PNC are
found to be high and similar for all indicators.
Impact Evaluation Surveys in Dhaka Urban Slums 2007, 2009 and 2011 53
Table 5.1.20. Demographic and socioeconomic variables associated with women's 4+
ANC, visits, institutional delivery, and PNC visit for the most recent birth in
Dhaka urban slums, 2007, 2009, and 2011
Demographic and
4+ ANC visits
1+ PNC visit
variable
Odds Ratioa (95% CI)
Odds Ratioa (95% CI)
Odds Ratioa (95% CI)
Type of area
1.19* (1.03-1.39)
2.17** (1.76-2.68)
1.96** (1.60-2.40)
Survey year
1.42** (1.19-1.70)
2.72** (2.09-3.52)
1.59** (1.24-2.04)
1.90** (1.56-2.31)
3.68** (2.81-4.82)
2.19** (1.71-2.79)
Duration of residence (year)
1.19 (0.97-1.45)
0.96 (0.78-1.18)
0.95 (0.78-1.16)
1.31* (1.10-1.56)
1.28* (1.06-1.54)
1.23* (1.02-1.48)
Birth-order
0.78 (0.68-0.91)
0.84 (0.72-0.98)
0.88 (0.76-1.02)
Highest educational level
1.31* (1.12-1.54)
1.20* (1.02-1.42)
1.18* (1.00-1.39)
1.96** (1.67-2.32)
2.05** (1.76-2.40)
1.99** (1.66-2.38)
Asset quintile
1.16 (0.95-1.40)
1.16 (0.95-1.42)
1.17 (0.99-1.40)
1.68** (1.36-2.08)
1.50** (1.17-1.92)
1.58** (1.29-1.95)
2.22** (1.75-2.82)
2.08** (1.68-2.58)
2.14** (1.77-2.58)
3.31** (2.60-4.21)
3.34** (2.66-4.20)
3.12** (2.52-3.85)
Wald Chi-square (13 df)
396.12, p<0.001
604.78, p<0.001
472.82, p<0.001
aAll odds ratios are adjusted for clustering of maternity care to women of the same clusters and for all other variables.
The dependent variable was coded 1 if women had 4+ ANC visits, delivery at facility or PNC visit, otherwise coded 0.
*p<0.05,**p<0.01
5.2 Pregnancy Complications and Management
Pregnancy and childbirth-related complications are among the leading causes of maternal
morbidity and mortality in Bangladesh. Though the knowledge and technology to
cure/prevent most of these complications are available, proper knowledge and awareness of
women and family members regarding the symptoms are crucial for health service use.
Impact Evaluation Surveys in Dhaka Urban Slums 2007, 2009 and 2011 54
Table 5.2.1. Percent distribution of women by complication and its management during
pregnancy with live births in the last one year in Dhaka urban slums, 2007, 2009, and 2011
Pregnancy complication
during pregnancy and its
Project area
Comparison area
management
Complications during pregnancy1
No complications
Severe headache/blurry
5.2 2.4 5.6 9.6 9.1 10.9
Smelly vaginal discharge
Excessive vaginal bleeding
Reduced/absent fetal
1.3 3.1 1.9 2.9 2.1 3.4
High blood pressure
Oedema in hands/feet
Lower abdominal pain
Untimely water break
First place for treatment of pregnancy complications
No complications
Did not seek any treatment
BRAC delivery hut 0.6
Government hospital 4.5
Private clinic/chamber
NGO health centre
Type of treatment received1
No complications
No treatment sought
Medicine from pharmacy
Referral from FHW
Spiritual water/substance
Homeopathic medicine
Injection/saline 0.3
Medicine from doctor/nurse
Medicine from Kabiraj/Hekim
0.6 0.0 1.1 0.2 0.2 1.6
Total number
1Multiple responses were possible; Kabiraj/Hekim refers to herbalists
Impact Evaluation Surveys in Dhaka Urban Slums 2007, 2009 and 2011 55
Table 5.2.1 presents the percent distribution of women by complications during pregnancy
and its management in Dhaka urban slums in 2007, 2009, and 2011. Pregnancy complications
reported were lower—26% in the project area compared to 36% in the comparison area in
2011. The most prevalent complication women reported in 2007, 2009, and 2011 was: lower
abdominal pain (8-14% in the project area, and 13-23% in the comparison area) and showed a
declining trend in either area over the years. The other complications reported more often
were: severe headache/blurry vision (2-6% in the project area and 9-11% in the comparison
area), and oedema in hands, feet, or face (4-12% in the project area and 7-14% in the
comparison area) in 2007, 2009, and 2011. Seeking no treatment amongst women having complications was very high with an area
difference—10% in the project area compared to 16% in the comparison area in 2011. For
treatment of pregnancy complications, private clinics were visited most frequently by women
(5% each) in 2011, followed by government hospitals (3% and 6% respectively), and NGO
health centres (3% each) in the project and the comparison areas. BRAC delivery hut was
used by 3% women in the project area in 2011. Type of treatment received did not show much difference between areas and years. The
predominant treatment type in 2011 was medicine from pharmacy (7% in the project areas
and 10% in the comparison area), followed by medicine from doctor or nurse (7% in the
project area and 8% in the comparison area). A few women (2-3%) got advice from the
family health workers. Referral for treatment in case of complications was few, and it was
mostly to government hospitals in the project area and private clinics in the comparison area,
followed by NGO health facilities in the project area and government hospitals in the
comparison area. The major reasons for referral were to get better treatment, followed by
unavailability of equipment in the facility and lack of required skills to treat complications.
One-third of the referrals did not adhere to the advice (data not shown).
Use of Misoprostol
Government of Bangladesh has approved the use of Misoprostol in the community for prevention and treatment of postpartum haemorrhage (PPH). Misoprostol is found to be safe for distribution by traditional providers. Women who had a live birth in the last one year were asked about the use of two tablets (Misoprostol) for prevention and treatment of PPH in 2011; the results are presented in Table 5.2.2. The use of Misoprostol was more frequent (53% versus 27%) in the project area than the comparison in 2011. The use-rate was higher in institutional delivery than in home-delivery in either area.
Table 5.2.2. Percent distribution of women who had a live birth in the last one year by use
of the Misoprostol and place of delivery in Dhaka urban slums in 2011
Project area
Comparison area
Place of delivery
18.5 81.5 464 12.8 87.2
BRAC delivery hut
69.3 30.7 163 61.5 38.5 78
66.7 33.3 165 57.5 42.5 40
Total number
Impact Evaluation Surveys in Dhaka Urban Slums 2007, 2009 and 2011 56
5.3 Immediate Newborn Care
Newborn babies are exposed to many infectious disease threats soon after birth. Persistently
high rate of low birthweight remains a very important health problem in Bangladesh. They
are particularly vulnerable to nutritional impairment as a consequence of complex
interactions between feeding practices, infections, and care practices.
Three cross-sectional surveys in 2007, 2009, and 2011 collected information on immediate
newborn care, morbidity experienced during neonatal period (within 1 month) and its
management in Dhaka urban slums; the results are presented in Table 5.2.3. In accordance
with women's knowledge on immediate newborn care (see Chapter 4), breast-milk as pre-
lacteal feeding after birth was higher―77% in 2011 and 71% in 2009 compared to 36% in
2007 in the project area. In the comparison area, it was higher―61% in 2011 and 45% in 2009
compared to 43% in 2007. On the other hand, the use of honey and sugar/glucose water as
initial feeding declined at a faster rate in the project and than in the comparison area over the
years. Compared to the use-level in 2007, the use of honey and sugar/glucose-water reduced
by 50% in 2009 and 60% in 2011 in the project area and by 43% in 2011 in the comparison
area.
Amongst all feeding practices, breastfeeding is one of the most critical. Inappropriate, and
inadequate breastfeeding have adverse consequences on the health and nutritional status as
well as the mental and physical development of children. WHO recommends that infants
should be exclusively breastfed for the first six months of life (with no other liquids or solid
foods or even plain water) and that the infants be initiated on solid (semisolid)
complementary foods, in addition to breast-milk after the sixth month of age. Exclusive
breastfeeding in the early months of life has been associated with improved child growth and
increased child survival and reduced risk of illness. Early breastfeeding improves the
probability of successful exclusive breastfeeding and lengthens the duration of breastfeeding.
The standard indicator of exclusive breastfeeding is the percentage of children aged less than
six months, who are exclusively breastfed. The standard indicator of complementary feeding
is the percentage of children aged 6-9 months, who are receiving both breast-milk and
complementary foods. It is recommended that breastfeeding be continued through the second
year of life.
Initiation of breastfeeding within one hour of birth increased in both areas over the years, and
the rate of increase was higher in the project area (increased from 50% in 2007 to 71% in
2011) than in the comparison area (from 49% in 2007 to 62% in 2011). The WHO
recommends that children be fed colostrum (the first flush of breast-milk) immediately after
birth, and more than 91% of women in 2011 provided colostrum within one day to their
newborn in both areas.
The practice of bathing just after birth is considered risky; this practice reduced markedly in
both areas over the years with a faster rate of decline in the project area. Giving bath just after
birth reduced from 55% in 2007 to 16% in 2011 in the project area and from 45% in 2007 to
29% in 2011 in the comparison area. Giving bath within the third day to one week after birth
increased in the project area from 12% in 2007 to 47% in 2011 and in the comparison area
from 20% in 2007 to 25% in 2011. A delay in timing of shaving baby's head has taken place
in both areas over the years with a higher rate of delay in the project area. Only a few babies'
heads were shaved within the second day of birth (2% in the project area and 2-4% in the
comparison area) each year. The percentage of the babies whose heads were saved within 3-7
Impact Evaluation Surveys in Dhaka Urban Slums 2007, 2009 and 2011 57
Table 5.2.3. Percent distribution of neonates born in the last one year by initial feeding and
other care in Dhaka urban slums, 2007, 2009, and 2011
Initial feeding and immediate
Project area
newborn care practices
Pre-lacteal feed after birth1
Sugar/glucose water
Any milk other than breast-milk
Other liquids 0.1
Initiation of breastfeeding
Breastfed within one hour of birth
Breastfed within one day of birth
Breastfed after first day of birth
Never breastfed 0.1
Received colostrums within one day
Timing of bathing the baby
Just after birth
Within 24 hours of birth
On the second day after birth
Within third day to one week after
12.5 41.5 47.1 20.4 24.4 24.6
Timing of shaving the baby's head
Just after birth
within 24 hours of birth
On the second day after birth
Within the third day to one week
91.4 83.3 72.2 84.6 87.5 77.2
Never shaved hair
Taken special cord-care of the baby
Wrapping the baby with warm clothes
Taken 'Kangaroo mother care' of the baby
Yes
100.0 100.0
Total number
1First thing put into mouth
Impact Evaluation Surveys in Dhaka Urban Slums 2007, 2009 and 2011 58
days after birth declined from 91% in 2007 to 72% in 2011 in the project area and from 85% in 2007 to 77% in 2011 in the comparison area. Shaving heads after one week increased from 6% in 2007 to 24% in 2011 in the project area and from 11% in 2007 to 17% in 2011 in the comparison area. Almost all women in either area took special cord-care of the baby, which is not recommended except for keeping it dry. However, there has been a gradual decline in the special cord-care over the years (from 98% in 2007 to 93% in 2011 in the project area and from 98% in 2007 to 91% in 2011 in the comparison area). The proportion of women taking ‘Kangaroo-mother care' (skin-to-skin contact between mother and child) was low (6%) in 2007, but increased to 12% in 2009 and to 17% in 2011 in the project area. In the comparison area, ‘Kangaroo-mother care' increased from 17% in 2007 to 23% in 2009 and to 21% in 2011 Table 5.2.4 presents the percent distribution of neonates born in the last one year by neonatal health check-up, complications, and management in Dhaka urban slums in 2007, 2009, and 2011. Health check-up of neonates within the first two days of life increased from 40% in 2007 to 67% in 2011 in the project area. It was not the case in the comparison area, it rather decreased from 50% in 2007 to 39% in 2011 in the same period. Reported complications/illnesses among the neonates were lower and comparable—33% in the project area and 34% in the comparison area in 2011. Common illnesses in order of prevalence, were fever, followed by cough, difficult breathing, jaundice, and rapid breathing in either area, or the prevalence was little lower in the project area than in the comparison area in 2011. Skin rash/pustule and umbilical infection were reported more often in the project area than in the comparison area. The percentage of seeking no treatment for neonates in case of complications/illness decreased more in the project area than in the comparison area over the years. The most common place for treatment of newborns in both areas was: private clinics, followed by government hospitals and pharmacy. Although allopathic medicines from pharmacy and from qualified doctors/nurses were used in great majority of the cases, homeopathic and herbal medicines were also used, to an extent. The use of spiritual water, substance, or amulets was very low (1%).
Impact Evaluation Surveys in Dhaka Urban Slums 2007, 2009 and 2011 59
Table 5.2.4. Percent distribution of neonates born in the last one year by complications
and their management in Dhaka urban slums, 2007, 2009, and 2011
Neonatal healthcare and
Project area
Comparison area
2007 2009 2011 2007 2009 2011
Health check-up within two days after birth
Yes 39.6
Complications within one month after birth1
No complications
Difficulty in breathing
Umbilical infection
skin rash/pustule
Inability to suck breast-milk
Lethargy/weakness
Baby became cold
Place of first treatment for complications
No complications
Did not seek any treatment
BRAC delivery hut
Government hospital
Private clinic/chamber
NGO health centre
Type of first treatment received1
No complications
No treatment sought
Medicine from pharmacy
Referral from female health worker
Advice from female health worker
Spiritual water/substance
Homeopathic medicine
Injection/saline
Medicine from doctor/nurse
Medicine from Kabiraj/Hekim
100.0 100.0
100.0 100.0 100.0
Total number
1Multiple responses were possible; Kabiraj/Hekim refers to herbalists
Impact Evaluation Surveys in Dhaka Urban Slums 2007, 2009 and 2011 60
CHAPTER 6: CHILD HEALTH IMMUNIZATION, MORBIDITY, AND
MANAGEMENT
6.1 Immunization
This chapter presents findings on several areas of importance to child health, including the
vaccination status of children and the prevalence and treatment of important childhood
illnesses. Knowing how vaccination coverage varies among different subgroups of population
can help planning public projects and interventions. Information on vaccination coverage is
also important for the monitoring and evaluation of the government's Expanded Programme
on Immunization (EPI).
Examining treatment practices and contact with health services for children with the three
most important childhood illnesses: diarrhoea, acute respiratory infection (ARI), and fever
can help assess national programme aimed at reducing mortality from these illnesses.
Information is provided on the prevalence of fever, ARI, and diarrhoea and the extent to
which treatment is sought from medically-trained care providers, pharmacies, and traditional
(unqualified) doctors.
Universal immunization of children aged less than one year against the six major vaccine-
preventable diseases (tuberculosis, diphtheria, pertussis, tetanus, poliomyelitis, and measles)
is one of the most cost-effective programmes to reduce infant and child morbidity and
mortality. The EPI is a priority programme of the Bangladesh Government which follows
WHO-recommended international guidelines. According to the guidelines, children are
considered fully immunized when they have received one dose of the vaccine against
tuberculosis (BCG); three doses each of the vaccine against diphtheria; pertussis (whooping
cough), and tetanus (DPT); three doses of polio vaccine (excluding polio vaccine given at
birth); and one dose of measles vaccine before their first birthday. Therefore, vaccination of
children aged 1-4 year(s) is presented to allow the comparison of results across the areas over
the years.
The three surveys collected data on coverage of different vaccines among children aged 1-4
year(s) in Dhaka urban slums in 2007, 2009, and 2011; the results are presented in Table
6.1.1. Ever-receiving vaccine for children was found universal in either area. The percentage
of receiving three or more polio vaccines was 87% in the project area compared to 83% in the
comparison area in 2011. The percentage of receiving three or more DPT doses was higher in
the project and comparison areas in 2011 (91% and 81% respectively) and in 2009 (82% and
77% respectively) than in 2007 (47% and 45% respectively).
Impact Evaluation Surveys in Dhaka Urban Slums 2007, 2009 and 2011 61
Table 6.1.1. Percent distribution of children aged 1-4 year(s) by vaccines received at
anytime before the survey in Dhaka urban slums, 2007, 2009, and 2011
Vaccinations received anytime
Project area
Comparison area
before the survey
2007 2009 2011 2007 2009 2011
Child ever received any vaccination
Type of vaccinations received
None 2.9
Number of vaccinations received – Polio
None 3.1
Number of vaccinations received – DPT
None 8.3
Complete vaccination coverage
100.0 100.0
Total number
Vaccinations are most effective when given at the proper age. Therefore, it is recommended
that children complete the schedule of immunizations during their first year of life (by 12
months of age). Complete vaccination coverage (measured in terms of receiving all the
recommended vaccinations, BCG, three doses of DPT, Polio, and measles) increased in the
project area from 38% in 2007 to 69% in 2009 to 79% in 2011 and in the comparison area
from 38% in 2007 to 62% in 2009 to 69% in 2011.
6.2 Children's Morbidity and Management
This section discusses three illnesses that are major contributors to childhood morbidity and
mortality in Bangladesh: diarrhoea, fever, and acute respiratory infection (ARI). Estimates of
the two-weekly prevalence of these illnesses as well as data concerning types of treatment
and feeding practices during diarrhoea are presented in Table 6.2.1. The overall prevalence
of morbidity among 1-4 year(s) old children was lower in 2009 than in 2007 and 2011 in
either area. The lower prevalence in 2009, could be due to difference in the timing of the
surveys; July-August (monsoon season) 2007, November-December (post-monsoon) 2009
and September-October (late monsoon) in 2011. Fever is a major manifestation of acute
Impact Evaluation Surveys in Dhaka Urban Slums 2007, 2009 and 2011 62
infections in children and occurs round the year. It contributes to high levels of malnutrition and mortality. Major children's morbidity in order of two-weekly prevalence were: fever (ranging from 28-45%), cough (23-35%), and diarrhoea (5-19%) in the project and the comparison area during 2007-2011. There is no consistent difference in the prevalence of morbidity between the two areas over the years.
Table 6.2.1. Percent distribution of children aged 1-4 year(s) by prevalence of common
childhood illnesses in the last two weeks in Dhaka urban slums, 2007, 2009, and 2011
Morbidity and healthcare-seeking
Project area
behaviour
2007 2009 2011 2007 2009 2011
Child had suffered from1
Difficulty in breathing
Chest in-drawing
Acute respiratory infection (ARI)2
Place of treatment for ARI3
Did not seek any treatment
BRAC delivery hut
Government hospital
NGO health centre
Place of treatment for diarrhoea
Did not seek any treatment
BRAC delivery hut
Government hospital
Private clinic/chamber
NGO health centre
100.0 100.0 100.0 100.0
Total number
1Multiple responses; 2Refers to cough with either rapid or difficult breathing, or chest in—drawing; 3Multiple responses for the children who suffered from ARI in the last two weeks
ARI, primarily pneumonia, is a leading cause of childhood morbidity and mortality throughout the world, and early diagnosis and treatment with antibiotics can reduce mortality due to ARI. The two-weekly prevalence of ARI has shown a declining trend (from 11% in 2007 to 8% in 2011) over the years in the project area but not in the comparison area. A lower percentage of mothers in the project area than in the comparison area did not seek treatment for ARI in 1-4 year(s) old children. In 2011, common places of treatment for ARI in the project and the comparison areas were: pharmacies (35% and 38% respectively),
Impact Evaluation Surveys in Dhaka Urban Slums 2007, 2009 and 2011 63
followed by private clinics/chambers (35% and 30% respectively) and government hospitals (17% and 14% respectively). For treatment of diarrhoea, common treatment places were: pharmacy, followed by private clinic and government hospitals in either area in 2007, 2009, and 2011. Mothers were encouraged to continue normal feeding to children with diarrhoea and to increase the amount of fluids they offered. In three surveys, mothers [with a child aged 1-4 year(s) having a recent episode of diarrhoea] were asked about what they gave the child to drink during the diarrhoeal episode compared to usual practice. Table 6.2.2 shows that in 2011, 95% of children with diarrhoea in the project area and 93% in the comparison area were given packet saline while it was 88% in the project area and 80% in the comparison area in 2007. Other liquids (such as coconut-water) were given to 35% of children with diarrhoea in the project area and 23% in the comparison area in 2011. The use of home-made saline was more frequent in the project area than in the comparison area.
Table 6.2.2. Percent distribution of children aged 1-4 year(s) sick with diarrhoea in the
last two weeks by management and features of diarrhoea in Dhaka urban slums, 2007, 2009, and 2011
Management and other
2007 2009 2011 2007 2009 2011
Food/fluid given during diarrhoea
Packet
87.7 92.5 94.7 80.0 90.9 93.3
7.8 16.4 8.0 9.5 6.1 0.0
24.0 46.3 34.7 32.6 45.5 23.3
Features of diarrhoea
Fever
22.7 17.9 25.3 26.3 27.3 20.0
20.1 22.4 14.7 17.9 33.3 30.0
51.9 58.2 61.3 40.0 45.5 60.0
Blood with stool
1.9 1.5 12.0 6.3 3.0 6.7
1.3 0.0 2.7 1.1 3.0 3.3
100.0 100.0 100.0 100.0 100.0 100.0
154 67 75 95 33 30
Diarrhoea is often accompanied with fever (25% in the project area and 20% in the
comparison area in 2011) and vomiting (15% in the project area and 30% in the comparison
area in 2011). Amongst children with diarrhoea, 61% of the episodes in the project area and
60% in the comparison area were characterized by watery stool and 7% each by blood in
stool. Diarrhoea causes dehydration if not managed with properly with fluids. Dehydration,
mostly sunken eyes, was present in 2.7% of the episodes in the project area and 3.3% in the
comparison area in 2011.
Impact Evaluation Surveys in Dhaka Urban Slums 2007, 2009 and 2011 64
CHAPTER 7: PERCEPTION ON DELIVERY FACILITIES AND
BRAC'S BIRTHING HUT
7.1 Opinion on Local Healthcare Facilities
In three cross-sectional surveys, questions were asked to the women on their perception of
local healthcare and delivery facilities, and data are analyzed to understand their perception
and presented in the Table 7.1.1. Availability of healthcare and delivery facilities increased
in either area over the years, and the increase was faster in the project area than in the
comparison area. For example, in the project area, 94% of women in 2011 compared to 53%
in 2007 reported availability of healthcare and delivery facilities in the locality. In the
comparison area, 63% of women in 2011 compared to 45% in 2007 reported the same. The
increase was due mainly to the existence of BRAC delivery huts in the project area, and
private clinics in either area.
Table 7.1.1. Percent distribution of women by their opinion on availability of health
services in the locality in Dhaka urban slums, 2007, 2009, and 2011
Opinion on services in local healthcare
Project area Comparison area
and delivery facilities
Healthcare and delivery facilities available in the slum area
Yes
52.6 85.1 93.6 44.8
47.4 14.9 6.4 55.2
Type of health facilities available1
47.4 14.9 6.4 55.2
BRAC delivery hut
NGO health center
38.2 41.3 34.9 39.3
Aspects of healthcare and facilities that satisfy women
Good behaviour of the staff
Availability of drugs/supplies
Do not have to wait
77.8 38.0 55.9 68.9
Willing to answer questions
16.5 29.4 30.2 16.9
Amiable and easy to communicate
Aspects of healthcare and facilities that would dissatisfy women1
Bad behaviour of the staff
Non-availability of drugs/supplies
Have to wait to get
35.4 36.6 50.7 38.1
Costly/unaffordable
20.6 38.4 35.2 19.9
Not willing to answer questions
Dirty/lack of cleanliness
Not friendly and hard to communicate
Treatment not effective/not cured
100.0 100.0 100.0 100.0 100.0
Total number
2,172 2,268 1,227 1,054 1,129
1Multiple responses
Impact Evaluation Surveys in Dhaka Urban Slums 2007, 2009 and 2011 65
Women were asked again about different "aspects of healthcare and facilities that satisfy
women" in three surveys. Results show a change (in terms of percentage of the report) in
aspects of satisfaction over the years within the areas. In 2007, the most frequently-
mentioned was: effective treatment (78% and 69% respectively) in the project and the
comparison area, followed by good behaviour of the staff (50% and 60% respectively), and
availability of drugs and supplies (39% and 32% respectively). In 2011, women mentioned
most frequently was: good behaviour of the staff (74% each) in the project and the
comparison areas, followed by availability of drugs and supplies (58% and 55% respectively)
and effective treatment (56% and 43% respectively). They are also asked about "aspects of
healthcare and facilities that dissatisfy women." The most frequently-mentioned dissatisfying
aspects in 2011 were: bad behaviour of the staff (71% and 68% respectively), non-availability
of drugs (50% and 48% respectively), long waiting-time to get treatment (51% and 46%
respectively), and not effective treatment (39% and 25% respectively) in the project and the
comparison area.
7.2 Awareness about BRAC's Birthing Hut
In the 2007, 2009 and 2011 surveys, women who had children in the last five years were
asked about the availability and usage of BRAC's birthing huts in their localities, and the
results are presented in Table 7.2.1. In the project area, awareness about BRAC birthing hut
increased over the years. Nine in every ten women in compared to 2011 one in every four
women in 2007 were aware of availability of the BRAC birthing hut in their locality. More
women were aware of the type of services BRAC birthing hut provided in 2011 than in 2007
and 2009. Common services it provides are: antenatal care (83%) followed by skilled
delivery assistance (59%) and delivery care (42%), newborn care (27%), and postpartum care
(16%), and the frequencies were higher in 2011 than in 2007 and 2009. Sources of
knowledge of the BRAC birthing hut were: BRAC's Shashthya Sebika/midwife (66%),
followed by own experience (24%), and friends/neighbours (17%), and the proportion was
higher in 2011 than in 2007. Majority (62%) of women registered to the birthing huts in 2011
compared to 38% in 2009 and 7% in 2007. They registered for antenatal check-up, delivery
care, and skilled delivery assistance.
Impact Evaluation Surveys in Dhaka Urban Slums 2007, 2009 and 2011 66
Table 7.2.1. Percent distribution of women who had a child in the last five years by
knowledge and usage of BRAC's birthing hut in Dhaka urban slums, 2007, 2009, and 2011
Project area
Knowledge and usage of services from BRAC's
birthing hut
BRAC's Birthing hut exists in the locality
Services provided by BRAC's birthing hut
Antenatal check-up
Skilled delivery assistance
Child healthcare
Source of information on BRAC birthing hut
From own experience
From family members
From neighbours/friends
From BRAC Shashthya Sebika/staff/midwife
From posters/leaflet/advertisement
From BRAC's other projects
Registered to BRAC's birthing hut
Services for which registered to birthing hut
Did not register
Antenatal check-up
Skilled delivery assistance
Child healthcare
Total number
1Multiple responses were applicable only for women who were aware of birthing hut in the locality
Impact Evaluation Surveys in Dhaka Urban Slums 2007, 2009 and 2011 67
CHAPTER 8: POLICY IMPLICATIONS OF THE MANOSHI'S
PROJECT IMPACT EVALUATION SURVEYS AND
CONCLUSIONS
8.1 Status of Maternal and Child Health in Dhaka Urban Slums
With increase in population density, landlessness, and decrease in farm-size, the
concentration of population in urban slums has been increasing in Bangladesh in recent times
(17). The Household Income and Expenditure Survey, in 2010 report, showed a slower rate
of decline in urban poverty compared to rural poverty (18), perhaps due to disproportionate
rural-to-urban migration of the poor households. Besides, the growing rural-urban migration
brings with it higher likelihood of health hazards within the urban slums. The levels of
maternal and newborn and childcare in slum population are comparable with rural population
but are substantially lower when compared with non-slum urban population (19, 20). Poverty
and ill-health constitute a vicious circle; due to ill-health, the poor are not able to raise their
income to improve their health conditions, and without good health, their likelihood of
escaping poverty is severely diminished (21,22).
Against these backdrops, Manoshi project undertook a community-based health solution
programme of BRAC and, was implemented within the urban slums to bring about
improvements in the level of maternal, newborn and childcare. The project involved different
stakeholders and bridged connections between the community, BRAC health workers, and
healthcare providers in public, private and NGO sectors. The project formed women's
groups to build social network and increase trust, imparted knowledge to women and family
members in maternal and newborn care, empowered community to address some of the
barriers that hinder translation of knowledge into practice, and addressed some of the issues
concerning ill-health and poverty.
8.2 Policy Implications of Manoshi Impact Evaluation Surveys in 2007, 2009, and 2011
Three cross-sectional surveys were conducted in Dhaka urban slums in 2007, 2009, and 2011
to generate statistics on knowledge and practices relating to maternal, newborn and childcare
of women who gave birth in one year preceding the survey. The baseline and follow-up
statistics on knowledge and practices portray noticeable changes in the project and the
comparison areas over the years, which bring forward some key policy issues.
Knowledge of pregnancy and post-delivery care
Pregnancy is an important stage of a woman's life and has the potential to influence the
growing foetus and the mother. Women's knowledge about requirements of ANC visits, TT
vaccination, and iron supplementation during pregnancy had been universal. However, only
half of them were aware of requirements of 4+ ANC visits (as per government
recommendations) even if women did not have any complication in any visit. One in ten
women did not know about the requirements of post-delivery care, including post-natal care,
(PNC), and one in seven did not know about the requirements of iron and vitamin A
supplementations after delivery. Three in four women did not have knowledge of the
requirement of 3+ PNC visits in either area.
Lack of adequate knowledge reiterates the importance of BCC for women and family
Impact Evaluation Surveys in Dhaka Urban Slums 2007, 2009 and 2011 68
members for raising awareness and translating knowledge into practice. Some women were
found to possess superficial knowledge on relevant issues of pregnancy and related care, even
after five years of intervention. Project needs to implement BCC campaigns more intensively
so that a critical mass of knowledgeable women is available to work as change-makers in the
future.
Knowledge of danger signs during pregnancy, delivery, and after delivery
More than half of the women could not name any life-threatening complication, such as
excessive vaginal bleeding, convulsions, oedema in face or high fever during pregnancy,
delivery or after delivery in either area. Knowledge has improved but, to a little extent, over
the years in the project area compared to the comparison area. The low level of knowledge
about the danger signs may stand as a barrier to greater use of maternal health services.
Further investigations are required to understand factors behind the low level of improvement
in knowledge in the project area compared to the comparison area over the years. This also
suggests scrutiny of the acceptability of the lay health workers within the community, quality
and content of training to impart health education, and level of understanding of the
communication materials within the community. Both quality and contents of BCC were not
easy to understand for a majority of women (23).
Knowledge about place for treatment/care provider
The most common place for treatment in pregnancy or delivery complications as perceived
by women were government health facilities, followed by private clinics and NGO health
centres in either area. BRAC delivery hut had emerged as a treatment place in the project
area; in 2011, three in ten women named BRAC delivery hut for such treatment. Through the
Manoshi's project, women became more aware of alternative places for treatment.
Sources of information
Although excess to mass media, mostly television, had been widespread, the main sources of
information on place for maternal healthcare had been ‘own experience', NGO workers, and
family members in either area; the BRAC community-based health volunteers were
additional sources in the project area only. Community-based counselling among small
groups with culturally appropriate BCC may make knowledge more widespread.
Knowledge of immediate newborns care and life-threatening health problem
Knowledge of drying newborn thoroughly just after birth, wrapping with warm clothes,
feeding colostrums as first feed, vaccination right after birth, and vitamin A for under-five
children had been universal in either area. Major causes of neonatal deaths were acute
respiratory infection (indicated by cough with fast or difficult breathing) and asphyxia
(BDHS 2004). Resuscitation training in facilities reduced deaths of neonates by 30%. Yet,
coverage of this intervention remained low and was a missed opportunity to save lives.
Despite some improvements over the years, women's knowledge on the life-threatening
conditions had been found to be low in both areas.
The implications of the findings are twofold. First, policy must address the low level of
knowledge regarding life-threatening conditions of newborn and, second, focus must be
placed on investigating the perception of people in the community regarding the project's
ability to treat newborns for such conditions. Further investigations must also be made for
understanding the reasons behind the low level of impact of the health volunteers of the
project in imparting knowledge.
Impact Evaluation Surveys in Dhaka Urban Slums 2007, 2009 and 2011 69
Knowledge of infant and young child-feeding practices
Mother's knowledge about timing of initiation of breastfeeding, duration of exclusive
breastfeeding and supplementary foods for child after exclusive breastfeeding had increased
over the years and became widespread in the project area than in the comparison area.
Knowledge of giving khichuri, vegetables, eggs, fish, meat, and fruits as supplementary
foods had improved more than any other foods in either area over the years. These positive
changes in knowledge may improve child nutrition in future.
Knowledge about pneumonia and diarrhoea
ARI after neonatal period is the major cause of death in Bangladesh (24). Three in five
women did not know symptoms of ARI, and knowledge had not improved in either area over
the years. Knowledge of giving packet saline for managing diarrhoea had been universal, but
one in five women had mentioned ‘less than usual' food to be given to children with
diarrhoea. BCC must be continued to ensure that mothers are aware of ARI symptoms; they
also need to be informed of the implications of not only providing saline to manage diarrhoea
but also of providing adequate amount of food to the child during diarrhoea.
Pregnancy planning for safe delivery
Saving money and planning for place of delivery and skilled delivery assistance ahead of
delivery were high; however, at least one in five women had no plan for delivery assistance
or had not saved money to meet extra expenses for childbirth. There remains a room for
improvements in the level of knowledge of life-threatening conditions in childbirth and
thereby generate the need for services among women and families within the community.
Use of maternal health services
Over the years, the use of maternal health services (4+ ANC visits, institutional delivery,
skilled delivery assistance and PNC visit) had increased at a faster rate in the project area
than in the comparison area. Pregnant women received services more frequently from the
government hospitals, private clinics, and NGO health centres in both areas. The use of
BRAC delivery hut for maternal health services had increased in the project area over the
years, indicating its acceptability to slum-dwellers. BRAC delivery hut in the slum is the low-
cost, welcoming, friendly and supportive maternity care centre and increases freedom of
choice (25).
The use of Misoprostol for prevention and treatment of postpartum bleeding was greater
(59% versus 27%) in the project area than in the comparison area in 2011. The use-rate was
higher for institutional delivery than for home-delivery, suggesting the importance for
promotion of institutional delivery and also community-based promotion of Misoprostol for
prevention and treatment of PPH.
Despite improvements brought about by Manoshi's project in the overall practice of maternal
health care in the project area, opportunities still exist and should be capitalized upon to
promote at least 4 ANC visits, institutional delivery, skilled delivery assistance, and PNC
care among all women. In addition to the BRAC midwife, similar to the government-
appointed community-based skilled birth attendants (CSBA), community mobilization has
been instrumental in increasing the skilled delivery assistance.
Impact Evaluation Surveys in Dhaka Urban Slums 2007, 2009 and 2011 70
Practices of immediate newborn's care
Infections kill about half of the neonates in Bangladesh (24). Many deaths can be prevented
through appropriate preventive and curative interventions for the newborns, including
management of neonatal infections. Giving bath and shaving baby's head soon after birth
were common in both areas, but delay had been more evident in the project area than in the
comparison area. Mother's knowledge about danger signs of newborns and consulting
qualified doctors in case of danger signs had not been high in either area. Change in
management had been very small in the project area over the years. Management of
newborn's complications can be done more effectively through community-based efforts;
training and deployment of community-based female volunteers to make mothers aware of
danger signs in neonates to seek care; and through recognizing and treating infections with
referral to accessible good-quality and dependable facilities.
Equity in the use of maternal health services
Slum-dwellers are of low income but heterogeneous in terms of earnings, education,
management skills, and access to health services. As such, economic and social inequalities
in health persist. With the implementation of the Manoshi's project, BRAC delivery huts
supported by community female volunteers had been instrumental, to a large extent, in
increasing the 4+ ANC visits, facility deliveries, and PNC visits in the project area compared
to the comparison area. Such approaches make access to health services easy to women of
less motivated households. The interventions benefited them more, and thereby reduced
economic and social inequalities. Increase in practices at higher rates in the disadvantaged
groups over the years had gradually reduced the inequalities (measured in terms of odds
ratio) between the poorest and the least poor or between women with lower and higher
education in the project area than in the comparison area. This leads to infer that a more
equitable use of maternal health services in the project area was due to the effects of
Manoshi's project. This relative success implies that scale-up of community-based health
solutions may reduce the inequalities further in the future.
Additionally, the study also indicates that the caesarean-section rate was as high as 34% in
the least poor quintile compared to 6% in bottom asset quintile in the project area in 2011.
Inequality was similar in the comparison area too. These figures suggest that many of the
surgical interventions were not medically necessary. In the lowest quintiles, caesarean-
section rate was low (6%), suggesting that poorer women did not receive adequate care.
8.3 Conclusion
The objective of the project undertaken by Manoshi Project was to improve the health of the mother, newborns, and children in urban slums through community-based solutions with aims to contribute to the achievement of MDG 4 and 5. The impact evaluation surveys in 2007, 2009, and 2011 provided evidences that positive changes took place at faster and higher rates in practices than in knowledge in the project slums than the comparison slums over the years. The impact surveys also evidenced reductions in socioeconomic inequalities in maternal and newborn-care and recorded high opinions of mothers in the provision of low-cost high-quality service and referral by the BRAC birthing hut. Lessons learnt from this intervention may be used effectively to further develop and improve the MNCH services in order to make it sustainable while scaling-up at the national level.
Impact Evaluation Surveys in Dhaka Urban Slums 2007, 2009 and 2011 71
REFERENCES
1. Economic and Social Commission for Asia and the Pacific. State of urbanization in Asia
and the Pacific 1993. Bangkok: United Nations. (http://www.khmerstudies.org/events/Water/Storey%20Nov%202005.pdf, accessed on 2 May 2010). (ST/ESCAP/1300, 1993).
2. United Nations. World urbanization prospects: the 2007 revision. New York, NY: United
Nations, 2008. 230 p.
3. Centre for Urban Studies (CUS), MEASURE Evaluation and National Institute of
Population Research and Training (NIPORT). Slums in Urban Bangladesh: Mapping and Census 2005. Dhaka, Bangladesh and Chapel Hill, NC, USA, May 2006. 51 p.
4. Bangladesh Bureau of Statistics. Bangladesh population census, Preliminary results 2011
5. Bangladesh Bureau of Statistics. Bangladesh population census 2001. Vol. 1. Analytical
report. Dhaka: Bangladesh Bureau of Statistics, 2007. 267 p. (Bangladesh Population Census Series).
6. Lein H. Hazards and ‘forced' migration in Bangladesh. Norsk Geogr Tidsskr
7. Khan SR. Achieving food security and becoming food surplus. Daily Star 2008 June 14.
(http://www.thedailystar.net/newDesign/news-details.php?nid=41001, access on July 10,
2010).
8. Afsar R. Internal migration and the development nexus: the case of Bangladesh. Dhaka:
Bangladesh Institute of Development Studies, 2003. 21 p.
9. Buckner B. Migration and migrant characteristics. Chapter 4. In: Angeles G, Al-Sabir A,
Lance P, Buckner B, Streatfield PK, Karar ZA, et al., editors. 2006 Bangladesh Urban Health Survey. Dhaka, Bangladesh and Chapel Hill, NC, USA: NIPORT, MEASURE Evaluation, ICDDR,B and ACPR. 2008:139-98.
10. Asian Development Bank. Bangladesh: urban primary health care project. Asian
Development Bank, 2007. 63 p. (http://www2.adb.org/Documents/PCRs/BAN/29033-BAN-PCR.pdf. (Project number: 29033), Accessed on .May 24, 2012).
11. United States Agency for International Development. NGO services delivery program
final report. United States Agency for International Development, 2007. 118 p. (http://pdf.usaid.gov/pdf_docs/PDACL345.pdf, accessed on July 10, 2010).
12. Government of the Peoples' Republic of Bangladesh. Local Government Division,
Ministry of LGRD & Cooperatives. Second Urban Primary Health Care Project (UPHCP-II). (http://www.uphcp.org/, access on July 10, 2010).
13. Government of the Peoples' Republic of Bangladesh. Ministry of Health and Family
Welfare. Health, nutrition, population sector project. Dhaka: Ministry of Health and Family Welfare, 2005. 336 p. (RPIP, Original: July 2003-June 2006).
Impact Evaluation Surveys in Dhaka Urban Slums 2007, 2009 and 2011 72
14. Ahsan KZ, Streatfield PK, Ahmed SM. Manoshi: community health solutions in Bangladesh.
Baseline survey in Dhaka urban slums 2007. Dhaka: International Centre for Diarrhoeal Diseases Research, Bangladesh, 2008. 52 p. (ICDDR,B scientific report no. 104).
15. Gwatkin DR, Rustein S, Johnson K, Pande RP, Wagstaff A. Socioeconomic differences
in health, nutrition, and population in Bangladesh. Washington, DC: World Bank, 2000. 28 p.
16. Norman GR, Streiner DL. Biostatistics: the bare essentials. St. Louis: Mosby, 1994.
17. Stevens J. Applied multivariate statistics for the social sciences. Hillsdale: Lawrence
Erlbaum Associates, 1986. 689 p.
17. Streatfield Peter Kim and Karar Zunaid Ahsan. Chapter 5: Community/Neighbourhood
Characteristics. Pp 199-216. In: 2006 Bangladesh Urban Health Survey. Dhaka, Bangladesh and Chapel Hill, NC, USA: NIPORT, MEASURE Evaluation, ICDDR,B and ACPR.
18. Government of Bangladesh, Bangladesh Bureau of Statistics, Ministry of Planning
(2011). Report of the Household Income and Expenditure Survey 2010.
19. National Institute of Population Research and Training. Bangladesh demographic and
health survey 2007. Dhaka: National Institute of Population Research and Training, 2009. 346 p.
20. National Institute of Population Research and Training. 2006 Bangladesh urban health
survey. Dhaka: National Institute of Population Research and Training, 2008. 546 p
21. Pryer Jane. (1989). When Breadwinners fall III: Preliminary Findings from a Case Study
in Bangladesh. IDS Bulletin Volume 20, Issue 2, pages 49–57
22. Davis Peter. (2007). Discussions among the poor: Exploring poverty dynamics with focus
groups in Bangladesh. Department of Economics and International Development, University of Bath, Claverton Down, Bath, BA2 7AY, UK. Chronic Poverty Research Centre. CPRC Working Paper 84, ISBN: 1-904049-83-4
23. Sarker Bidhan Krishna, Mridha Malay Kanti, Dasgupta Sushil Kanti, Islam Noushin and
Reichenbach Laura (2012). The effect of behabiour change communication (BCC) interventions on maternal, neonatal and child health (MNCH) knowledge in urban slums of Bangladesh.
MANOSHI Working paper No. 17, pp 48. 2012
24. National Institute of Population Research and Training. Bangladesh demographic and
health survey 2004. Dhaka: National Institute of Population Research and Training, 2005. 346 p.
25. Islam Z, Olivers E, Saha N C, Islam M, Walker D G, Koblinsky M (2009) Urban Slum
Dwellers "Willingness to Pay" A Study of the Manoshi Delivery Centres in Dhaka. Manoshi Working Paper Series No. 4, icddr,b, 68, Shaheed Tajudddin Ahmed Sarani, Mohakhali, Dhaka 1212, Bangladesh.
Impact Evaluation Surveys in Dhaka Urban Slums 2007, 2009 and 2011 73
Source: http://www.bracuk.net/wp-content/uploads/2015/11/Manoshi-Evaluation-Surveys-Report11_Final.pdf
A newsletter for Michigan State University Retirees LANSING AREA LOCAL EDITION April 2011 MSURA Annual Meeting MSURA Annual Meeting & Volunteer Award Luncheon Monday, May 9, 2011, Kellogg Center Big Ten Room C MICHAEL PATRICK SHIEL HEADLINES MAY BANQUET Author, Producer, Golfing, Celebrity Cozier & Advisor at the Kellogg Wow, what a treat awaits MSU retirees at noon on the 9th of May. Shiels was thelast producer for the J.P. McCarthy morning show on WJR-Detroit and produced atribute CD for J.P. that raised $500,000 for leukemia research. He has writtenwidely on a number of subjects, including golf course architecture and architects;on playing that fractious game (Golf's Short Game for Dummies); his travelarticles have been published in a number of magazines (Golf Digest, BusinessTraveler and others); and he has produced TV segments for ESPN, Golf Network,USA Network & CBS Sports. He even has a book out that tells you how to cozy up
Faith2Share Leaders' Retreat, Consultation and Training Modules 3-10 October 2014 Red Cross Training Centre, Addis Ababa, Ethiopia When two walk together The senior leaders of the member agencies and movements of Faith2Share have met together about every 15 months for the past 14 years. In 2000 it was just six people who met together but this year we gathered almost 70 from over twenty different nations. Our theme this year was "When two walk together: Building effective partnerships in mission leadership for global impact". This was an allusion to Amos 3:3 which asks, "Do two walk together, unless they have agreed to do so?" As one of our Bible study leaders reminded us we need to read this whole thing backwards, ie. Global impact comes from mission leaders who are in effective partnerships because they walk together before God. Our fellowship together was also blessed by meeting together in a land, Ethiopia, where Christians have walked together before God for at least fourteen centuries. We had a strong participation during this time of mission and church leaders from Ethiopia and we hope that our time together was also a blessing to them. Together in three ways Following discussions at our last Leadership Consultation in Bangkok in 2013, we decided this time to meet together in three different ways, or for three different stages. We began with