Characterizing new fluorescent tools for studying 5-ht3 receptor pharmacology


Contents lists available at
Characterizing new fluorescent tools for studying 5-HT3 receptorpharmacology
Thomas Jack , Jonathan Simonin Marc-David Ruepp Andrew J. Thompson , Jürg Gertsch , Martin Lochner *
a Department of Chemistry and Biochemistry, University of Bern, Freiestrasse 3, 3012 Bern, Switzerlandb Institute of Biochemistry and Molecular Medicine, University of Bern, Bühlstrasse 28, 3012 Bern, Switzerland
The pharmacological characterization of ligands depends upon the ability to accurately measure their
Received 18 July 2014
binding properties. Fluorescence provides an alternative to more traditional approaches such as radio-
Received in revised form
ligand binding. Here we describe the binding and spectroscopic properties of eight fluorescent 5-HT3
receptor ligands. These were tested on purified receptors, expressed receptors on live cells, or in vivo. All
Accepted 16 November 2014
compounds had nanomolar affinities with fluorescent properties extending from blue to near infra-red
Available online 22 November 2014
emission. A fluorescein-derivative had the highest affinity as measured by fluorescence polarization (FP;1.14 nM), flow cytometry (FC; 3.23 nM) and radioligand binding (RB; 1.90 nM). Competition binding with
3 receptor agonists (5-HT, mCPBG, quipazine) and antagonists (granisetron, palonosetron,
tropisetron) yielded similar affinities in all three assays. When cysteine substitutions were introduced
into the 5-HT3 receptor binding site the same changes in binding affinity were seen for both granisetron
and the fluorescein-derivative, suggesting that they both adopt orientations that are consistent with co-
crystal structures of granisetron with a homologous protein (5HTBP). As expected, in vivo live imaging in
anaesthetized mice revealed staining in the abdominal cavity in intestines, but also in salivary glands.
The unexpected presence of 5-HT3 receptors in mouse salivary glands was confirmed by Western blots.
Overall, these results demonstrate the wide utility of our new high-affinity fluorescently-labeled 5-HT3receptor probes, ranging from in vitro receptor pharmacology, including FC and FP ligand competition, tolive imaging of 5-HT3 expressing tissues.
2014 Elsevier Ltd. All rights reserved.
High-affinity, radiolabeled 5-HT3 receptor antagonists are
commercially available and have been frequently used to charac-
Abbreviations: 5-HT, 5-hydroxytryptamine (serotonin); ACh, acetylcholine;
terize 5-HT3 receptors in live cells and in in vitro binding assays
FACS, fluorescence activated cell sorting; FC, flow cytometry; FLAG, peptide tag
(However, fluorescent li-
DYKDDDDK; FP, fluorescence polarization; G-AD, granisetron-acridone; G-CN,
gands can provide alternative opportunities for quantifying binding
granisetron-fluorescein; G-TMR, granisetron-5-
interactions using fast, economical and information rich methods
tetramethylrhodamine; G-TO, granisetron-thiazole orange; G-RhB, granisetron-
that do not generate radioactive waste and can be more easily
rhodamine B; G-R101, granisetron-rhodamine 101; G-SiR, granisetron-Si-rhoda-mine; mCPBG, meta-chlorophenylbiguanide; PTX, picrotoxin; RB, radioligand
adapted to high-throughput technologies.
Fluorometric methods have been used in high-resolution mi-
* Corresponding author. Tel.: þ41 31 631 3311; fax: þ41 31 631 4272.
croscopy to observe phenomena, such as the movement and
E-mail addresses: (T. Jack),
internalization of cell-surface receptors, distances between fluo-
(A.J. Thompson), (J. Gertsch),
rophores and the physical environments within proteins, among
(M. Lochner).
other uses ). For
1 The authors made equal contributions to the study.
quantitative cellular and molecular pharmacological measure-
2 Present address: Pharmacology Department, University of Cambridge, Tennis
ments flow cytometry (FC) and fluorescence polarization (FP) can
Court Road, Cambridge CB2 1PD, UK.
0028-3908/ 2014 Elsevier Ltd. All rights reserved.
T. Jack et al. / Neuropharmacology 90 (2015) 63e73
be used. However, the challenge with these techniques is the cre-
pharmacological characterization and new tools to allow the effi-
ation of fluorescent tracers that have a sufficiently high affinity for
cient analysis of receptor binding will be useful.
the protein target and give suitable fluorescent signals that are
Here we describe the spectroscopic and ligand binding proper-
sufficiently higher than background. Here, we use the 5-HT3 re-
ties of a wider range of nanomolar affinity fluorophores that use
ceptor as a model system to test the utility of fluorophores conju-
granisetron as a ligand scaffold. We provide mutagenesis data that
gated to a competitive antagonist of this receptor.
shows (i) the fluorescent probes bind to the same site as the gra-
The 5-HT3 receptor is a ligand-gated ion channel related to
nisetron scaffold, (ii) describe two pharmacological assays (flow
nicotinic acetylcholine (nAChRs), g-amino butyric acid (GABAA) and
cytometry and fluorescence polarization) which give robust and
glycine receptors (). These receptors are
reproducible results that are the same as those determined using
referred to as the Cys-loop family and are located in the cell
radioligand methods, and (iii) show the utility of the fluorophores
membranes of central and peripheral synapses where they are
in determining the localization of receptors in in vivo imaging. As
responsible for fast neurotransmission. All of these receptors
such, these results represent the first description of a molecular
consist of an extracellular domain, a transmembrane domain and
toolkit that encompasses the whole fluorescent spectrum, making
an intracellular domain. When agonists bind to extracellular
it appealing for a broad range of 5-HT3 receptor studies.
binding sites a conformational change opens a transmembranepore, allowing ions to enter the cell. Compounds that compete at
2. Experimental procedures
these sites and prevent opening of the pore are known as
2.1. Chemicals & drugs
competitive antagonists, and several are marketed as antiemeticdrugs that alleviate symptoms resulting from chemotherapy,
Granisetron, palonosetron and tropisetron were synthesized according to pub-
lished procedures (
radiotherapy and general anesthesia (
5-HT (serotonin) creatinine sulfate, acetylcholine (ACh)
5-HT3 receptor competitive antago-
chloride, quipazine maleate, g-aminobutyric acid (GABA), glycine and picrotoxin
nists are also less frequently used to treat irritable bowel syndrome
(PTX; an equimolar mixture of picrotoxinin and picrotin) were obtained from Sigma
(IBS), and there is interest in partial agonists for treating the same
Aldrich (St. Louis, MO, USA). mCPBG was from Tocris. Human 5-HT3A (Accession:
disorder (). There have also been suggestions that
46098) subunit cDNA was kindly provided by J. Peters (Dundee University, UK). Thesynthesis of fluorescent granisetron derivatives G-CN, G-FL and G-RhB (was
5-HT3 receptor antagonists could be used to control neurological
described previously (). Fluorescent gra-
disorders such as depression, drug abuse, schizophrenia, fibromy-
nisetron conjugates G-SiR, G-TO, G-R101, G-TMR and G-AD (were synthe-
algia, pruritus and pain
sized accordingly (for detailed description of synthetic procedures, for full
Recent literature shows that new 5-HT
spectroscopic characterization and purity assessment see ).
gands continue to be identified, with particular interest in allosteric
Briefly, fluorophores were either purchased (rhodamine 101 and acridone; SigmaAldrich) or synthesized according to published procedures
modulators and sub-type selective ligands (
and coupled to the granisetron core
via linkers.
Fig. 1. A). Chemical structures of the fluorescent granisetron conjugates described here. Chemical structures of antagonists (B), agonists (C) and negative controls (D) used incompetition assays.
T. Jack et al. / Neuropharmacology 90 (2015) 63e73
Tween-20 and 5% skimmed milk powder, before incubating with the 1� antibodiesgoat anti-FLAG (1:3000, Bethyl Laboratories, Montgomery, USA) and mouse anti-
A FLAG-myc-tagged human 5-HT3A subunit expression construct was created
myc (1:500, Invitrogen) in TBS-tween-milk overnight at 4 �C. Membranes were
by fusion PCR and subsequent cloning into the XbaI and NotI sites of the lentiviral
washed 5� for 5 min each with TBS-tween and incubated for 2 h at room temp with
expression Vector pCDH-CuO-EF1-RFP (System Biosciences, CA, USA). The resulting
the 2� antibodies donkey anti-goat IRDye800 (1:10,000, Li-Cor) and donkey anti-
cDNA coded for a double-tagged protein with the FLAG-tag (DYKDDDDK) inserted
mouse IRDye680 (1:10,000, LI-COR) in TBS-tween-milk at room temp. After 5�
after amino acid 23 of the 5-HT3 receptor, followed by the myc-tag, inserted after
washes with TBS-tween, membranes were scanned using the Odyssey Imaging
amino acid 29. The construct was verified by DNA sequencing. Mutagenesis was
System (LI-COR).
performed using the QuikChange method (Agilent Technologies Inc., California,
To determine the expression of 5-HT
3 receptors in mouse, total protein lysates
from brain, colon, skeletal muscle, salivary gland mandibular and salivary glandparotid were purchased from Zyagen (San Diego, CA, USA), mixed 1:1 with 2� LDS
2.3. Cell culture
buffer and boiled for 25 min at 60 �C and 37.5 mg total protein lysate loaded on 3e8%
Human embryonic kidney (HEK) 293T cells were grown in DMEM/F12 (Gibco,
NuPage Tris-Acetate gels. Proteins were transferred to nitrocellulose and incubated
Life Technologies, CA, USA) supplemented with 10% fetal bovine serum (FBS; Bio-
over night at 4 �C with goat anti-5-HT3 (Santa Cruz, sc-19152, 1:100 in TBS-Tween-
Concept, Allschwil, Switzerland) at 37 �C in a moist atmosphere containing 5% CO2.
Milk) followed by Donkey anti-Goat IRDye800CW (LI-COR, 1:100 000 in TBS-Tween-Milk) for 1.5 h at room temperature.
2.4. In vivo imaging
2.8. Fluorescence polarization
C57BL male mice (6e10 weeks old, 20e25 g body weight) were housed under
standard environmental conditions (n ¼ 5 per cage) at 22e24 �C under a 12 he12 h
Purified 5-HT3 receptors were quantified as described above and a molarity
lightedark cycle supplied with food and water ad libitum. Mice were anesthetized
calculated using a molecular weight of 276 kDa (calculated using the online tool
and shaved carefully on their underside and immediately injected i.p. with 5 mg/kg
ExPASy PeptideMass). Concentrations of purified 5-HT3 receptor were prepared in
of G-SiR dissolved in DMSO in an injection volume of 15 ml. After 5, 10, 20 min and 1 h
PBS þ 2 mM C12E9 on ice. 2 nM of fluorescent ligand was added in a total volume of
images were recorded in a IVIS Lumina II instrument (Caliper Life Sciences) using
25 mL/well in NUNC 384-well flat bottom black plates (Greiner Bio-One Ltd, Stone-
filter set 3 (excitation 615e665 nm; emission 695e770 nm) at 37 �C. Control mice
house, UK) and incubated for 1 h in the dark at room temp. Polarization was
were injected with vehicle (DMSO). Upon completion of the experiments the mice
measured with a FARCyte Ultra Plate Reader (Tecan Gp LTS, M€
annedorf, Switzerland)
were sacrificed and organs dissected. Images were obtained in 3 independent ex-
with 485 nm excitation and 535 nm emission, gain fixed at 100 and the Z-position
periments. Animals were handled in accordance with the Code of Ethics of the
optimized. For the measurement of non-specific binding a saturating concentration
of either granisetron (10 mM) or quipazine (1 mM) was added, with both givingsimilar results. Raw data were processed using the integrated XFLUOR4 v4.51
2.5. Virus production
software. Competition measurements were made by incubating compounds(0.01 nMe100 mM) with 3 nM 5-HT
FuGene HD (Promega, WI, USA) was used to transfect HEK 293T cells with pCDH-
3 receptor and 2 nM fluorescent ligand using the
CuO-FLAG-myc-5HT3-EF1-RFP, pCMVDR8.91 and pMD2.G according to establishedmethods ). Lentiviral supernatants were collected 48,72 and 96 h post transfection and filtered through a 0.45 mM polyethersulfone sterile
2.9. Flow cytometry
filter (Millipore Corp, MA, USA). For transduction, HEK 293T cells were incubated
HEK 293T cells stably expressing the 5-HT3 receptor were grown in monolayers
with lentiviral supernatants supplemented with 5 mg mL�1 polybrene (hex-
and harvested from a 90 mm culture dish using 10 mL 1:250 Trypsin-EDTA
adimethrine bromide, Sigma Aldrich). After 7 h, polybrene was diluted to
(Amimed) for 10 min at 37 �C. The digestion was terminated by the addition of
2.5 mg mL�1 by the addition of fresh DMEM/10% FBS, and the procedure repeated for
25 mL DMEM þ 10% FBS and cells pelleted at low speed for 2 min. The pellet was
two days. After expansion of the transduced cells, highly RFP positive cells were
resuspended in 3 mL PBS containing 10 mM EDTA, 1 mM MnSO4 and 50 U mL�1
collected by fluorescence-activated cell sorting (FACS) to yield a highly transduced
Cyanase (RiboSolutions, Inc, Cedar Creek, TX, USA) (PBS-EMC). Cells were filtered
through a cell strainer (BD Falcon, Franklin Lakes, NJ, USA) and, for saturationstudies, incubated with 0.1 nMe20 mM G-FL in the presence or absence of 1 mM
2.6. Protein purification
quipazine or 10 mM granisetron for 15 min at room temperature; for competition
HEK 293T cells stably expressing FLAG-myc-5-HT
studies varied concentrations of non-labeled ligands were co-incubated with 10 nM
3 receptor were grown as
monolayers in T300 plates. At a density of 80%, cells were washed once with
G-FL. Cells were pelleted and washed in PBS-EMC containing 50 mg mL�1 bovine
phosphate buffered saline (PBS (mM); 0.1 NaCl, 2.0 Na
serum albumin, before being resuspended in the same buffer and analyzed on a
2HPO4, 0.54 KCl, 0.4 KH2PO4,
pH 7.4), mechanically detached into PBS, collected by centrifugation at 500 g for
FACScan flow cytometer (Becton Dickinson, Franklin Lakes, NJ, USA), equipped with
5 min, snap frozen in liquid N
a solid state laser from Cytek (Cambridge, UK) at 485 nm excitation/535 nm emis-
2 and stored at �70 � C until needed. After defrosting,
cells were diluted with 2 mL TriseEDTA (50 mM TriseHCl, 0.5 mM EDTA, pH 7.5)
sion, running the integrated CellQuest Pro software.
containing Halt Protease Inhibitor (Pierce, Thermo Scientific, IL, USA) and ho-mogenized with a 5 mL cell-douncer, followed by trituration through 21-gauge and
2.10. Radioligand binding
27-gauge needles. Soluble proteins were removed by centrifugation at 100,000 g
Saturation binding (8 point) curves were determined by incubating crude ex-
for 30 min, and the membrane fraction dissolved in 10 mL PBS þ 2 mM C12E9,
tracts of HEK 293T cells stably expressing 5-HT3 receptors in 0.5 mL HEPES buffer
before being incubated head-over-tail for 1 h at 4 �C; a concentration of the micelle
(pH 7.4) containing 0.1e20 nM [3H]granisetron. Competition binding (10 point) was
forming polyether that is higher than the critical micelle concentration (�
determined by incubating the same cell extracts in 0.5 mL HEPES buffer (pH 7.4)
Insoluble fractions were removed by centrifugation at 100,000 g for 1 h
containing 0.75 nM [3H]granisetron and differing concentrations of competing li-
and the supernatant incubated with anti-FLAG M2 agarose beads (Sigma Aldrich),
gands. Non-specific binding was determined with 1 mM quipazine or 10 mM tro-
head-over-tail for 2 h at 4 �C. Bound beads were washed 5� with PBS þ 2 mM
pisetron which gave similar results. Incubations were terminated by filtration onto
C12E9 and protein recovered by incubating with 250 mL PBS þ 0.4 mM C12E9
Whatman GF/B filters (Sigma Aldrich) and radioactivity measured using a Tri-Carb
supplemented with 1 mg mL�1 FLAG peptide (Pepnome Ltd, Zhuhai, China) for
2100TR (Perkin Elmer, Waltham, MA, USA) scintillation counter.
30 min. The eluate was recovered by centrifugation of the suspension throughMicro Bio-Spin columns (Bio-Rad, California, USA) at 500 g for 1 min. This was
2.11. Data analysis
dialyzed with a 10 K MWCO Slide-A-Lyzer (Thermo Scientific, Waltham, MA, USA)overnight in PBS þ 0.4 mM C12E9, aliquoted, snap frozen in liquid N2 and stored
All data analysis was performed with GraphPad Prism v5.00 (GraphPad Soft-
ware, San Diego, CA, USA). For FC, FP and RB saturation experiments, data wereanalyzed by iterative curve-fitting according to:
2.7. Protein purity & quantification
To determine purity and yield of 5-HT
3 receptors from transfected HEK 293 cells,
20 mL of the eluate and pepsin standards were subjected to SDS-Page on a 4e12%NuPAGE Novex Bis-Tris gel (Life Technologies), followed by colloidal Coomassie
where y is bound ligand, Amax is the maximum signal at equilibrium, Kd is the
staining, imaging and quantification using a LI-COR Odyssey infrared system (LI-COR
equilibrium dissociation constant, and [L] is the free concentration of labeled ligand.
Biosystems, NE, USA). To verify the results of Coomassie staining, samples were
FC, FP and RB competition data were analyzed by iterative curve fitting ac-
subjected to amino acid analysis using HPLC (column Novapack C18, 60 Å,
3.9 � 150 mm) after hydrolysis in 6 M HCl.
For Western blotting, proteins were transferred to a 0.22 mM nitrocellulose
membrane using the iBlot Dry Blotting System (Invitrogen, CA, USA). Membranes
were blocked for 1 h in TBS (50 mM TriseCl, 150 mM NaCl, pH 7.5) containing 0.1%
1 þ 10½L��log IC50
T. Jack et al. / Neuropharmacology 90 (2015) 63e73
where Amin is the minimum signal, Amax is the maximum signal, [L] is the concen-tration of competing ligand and IC50 the concentration of competing ligand thatblocks half the signal.
Ki values were determined from the IC50 values using the ChengePrusoff
where Ki is the equilibrium dissociation constant for binding of the unlabeled ligand,[L] is the concentration of labeled ligand and Kd is the equilibrium dissociationconstant of the labeled ligand.
Kinetic parameters were determined according to the following model of a
simple bimolecular binding scheme:
where L is the free ligand concentration, R is receptor concentration, LR is theligandereceptor complex and kon and koff are the microscopic association anddissociation rate constants. In a simple scheme such as this, the equilibrium disso-ciation constant (Kd) is equal to the ratio of dissociation to association rate constants,such that:
Dissociation was measured by allowing labeled ligands to reach equilibrium and
then adding a final concentration of 1 mM quipazine ( Kd � 106) for varying timeperiods. Dissociation data were fitted to either a single or double exponential decayto yield koff. To determine the association rate (kon), the observed association rate(kobs) was measured for a range of labeled ligand concentrations. The experimentwas started (t ¼ 0) by the addition of labeled ligand and the signal measured atvarying time points to construct association curves. Association curves were fitted toa single exponential association to calculate kobs, which is a product of both the rateskon and koff. If kobs is plotted against the ligand concentration, according to the simplemodel (4), the slope of this plot equals the association constant (kon) and the y-intercept of this line (at x ¼ 0) is the dissociation constant (koff). kon can also becalculated as described by where koff is predetermined from liganddissociation rate experiments.
All values in the manuscript are shown as the mean ± sem of independent
3.1. Properties of fluorophores
We have synthesized a series of 5-HT3 receptor ligands con-
taining a granisetron scaffold conjugated to diverse fluorophores(). A summary of their spectral and binding propertiesis shown in . Competition of [3H]granisetron withvaried concentrations of these fluorescent granisetron-derivativesrevealed nanomolar affinities for all compounds, with the highestaffinity shown by the fluorescein derivative G-FL. Quantum yieldsand molar extinction coefficients were generally high, giving strongfluorescent intensities. These results clearly show that large moi-eties can be attached to positions N1 and C7 of granisetron withoutloss of binding.
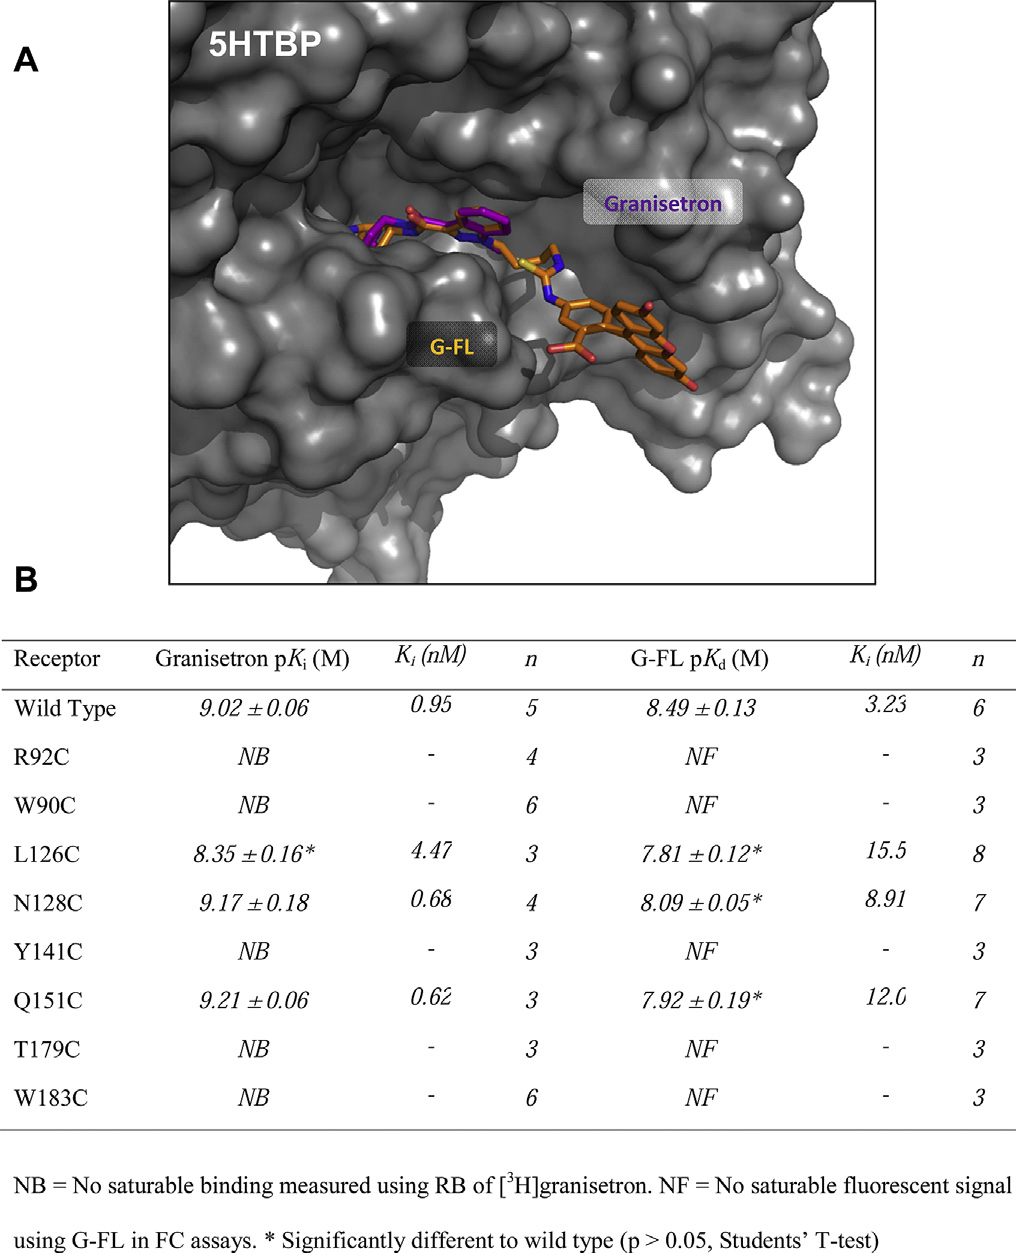
3.2. Effects of mutating the 5-HT3 receptor binding site
Granisetron has been co-crystallized with 5HTBP, a homologue
of the 5-HT3 receptor extracellular domain Todetermine if G-FL binds in a similar location and orientation wemade a series of cysteine mutations within four of the six recog-
Fig. 2. Properties of fluorescent ligands. Absorption (A) and emission (B) spectra of
nized binding loops of the 5-HT3 receptor and measured both G-FL
fluorescent granisetron-derivatives. (C) Radioligand competition binding of G-FL with
and granisetron binding. These mutations were in loops A (L126C,
0.75 nM [3H]granisetron, a radiolabeled form of the scaffold to which the fluorophores
N128C), B (T179C, W183C), D (R92C, W90C) and E (Y141C, Q151C)
were conjugated.
which were chosen as they show more sequence conservation thanthe two remaining loops C and F.
T. Jack et al. / Neuropharmacology 90 (2015) 63e73
Table 1Spectroscopic and binding properties of granisetron fluorophore conjugates.
Absorption peak (nm)
Emission peak (nm)
a Measured using radioligand competition with [3H]granisetron. ε ¼ molar extinction coefficient measured in PBS. FF ¼ quantum yield of fluorescence. Values were
determined using the methods described in . G-TO is self-quenching and only emits fluorescence when bound to 5-HT3 receptor.
b Taken from Fluorophores are: AD, acridone; CN, coumarin; FL, fluorescein; TO, thiazole orange; TMR, 5-TAMRA; RhB, Rhodamine B; R101,
Rhodamine 101; SiR, Si-rhodamine. Brightness ¼ FF � ε (All measurements were made in PBS.
The locations of the substitutions and the affinities of the
3.4. Fluorescence polarization
mutant receptors are shown in With G-FL five of the eightmutants (R92C, W90C, Y141C, T179C, W183C) showed no detectible
G-FL displayed the highest affinity in radioligand competition
fluorescent signal, and the remaining three (L126C, N128C, Q151C)
assays, showed suitable fluorescence intensity, and had fluorescent
had a decreased affinity when compared to wild type receptors.
properties that were compatible with the filters in our FP system
Using RB, [3H]granisetron saturation binding showed a similar
(Addition of 2 nM G-FL to increasing concentrations of
pattern of changes, suggesting that granisetron and G-FL adopt
purified 5-HT3 receptor gave a saturable increase in FP (A).
broadly similar orientations. To assess the suitability of this novel 5-
These data were fitted with Eq. yielding a pKd of 8.94 ± 0.07
HT3 receptor fluorophore, we explored its use in FC and FP assays.
(Kd ¼ 1.15 nM, n ¼ 6). In the presence of excess unlabeled ligand FPsignals were reduced to background levels.
3.3. Purification of 5-HT
The binding affinity of G-FL was also calculated by the inde-
pendent measurements of association and dissociation kinetics,
FP required purified 5-HT
according to Eq. Association curves for G-FL were fitted with
3 receptor that was achieved using
HEK 293T cells stably expressing an N-terminal fusion protein.
mono-exponential functions to give kobs (Plotting kobs
Initial purifications used an N-terminal myc-tag, but the high
against the receptor concentration produced a straight line fit that
abundance of endogenous c-myc proteins prevented efficient
yielded kon and koff that gave a Kd of 0.4 nM (Eq. C). The
enrichment of the myc-tagged receptor by immunoprecipitation.
value for kon calculated with this method was similar to the average
Subsequent purifications with an N-terminal FLAG-tagged 5-HT
value determined directly from k
values using Eq.
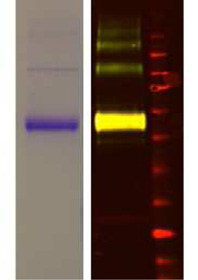
receptor were more successful. The purity and identity of the FLAG-
(1.39 � 107 M�1 s�1). A direct measurement of dissociation by the
tagged receptors was confirmed by Coomassie staining, Western
addition of excess unlabeled competitive ligand to G-FL equili-
blot and mass spectrometry of excised bands (inset).
brated cells was also monophasic, with koff values (0.001 s�1) that
Quantification of purified 5-HT
were similar to those determined from plots of k
receptors showed yields of
obs against ligand
90 ± 19 mg mL�1 eluted protein (n ¼ 4) from 1200 cm2
concentration D). These results show that fluorescent
( 3 � 105 cells/cm2), which is 83 pmol. This is the equivalent of
granisetron-derivatives are suitable for the measurements of ligand
106 binding sites/cell. Concentrations calculated from RB were
affinity and binding kinetics.
slightly higher ( 250 pmol/mg). These results show that it is
In the presence of 2 nM G-FL and 2 nM purified 5-HT3 receptor,
possible to isolate purified 5-HT
known competitive ligands (agonists and antagonists) reduced FP
3 receptor in quantities that are
sufficient for biological applications.
in a concentration-dependent manner E and F, FP
Table 2Affinities of competitive ligands measured using FC, FP and RB.
Radioligand binding
a FP assays used 2 nM G-FL.
b FC assays 10 nM G-FL.
c Radioligand competition 0.75 nM [3H]granisetron. NB ¼ no detectible binding.
T. Jack et al. / Neuropharmacology 90 (2015) 63e73
performed radioligand binding with [3H]granisetron. Saturationbinding with [3H]granisetron and competition binding with knowncompetitive ligands gave similar affinities to those measured usingFC and FP A inset, ). Also consistent with FC and FP, atconcentrations of up to 100 mM, binding was unaffected by the non-competitive ligand PTX, or the Cys-loop receptor agonists ACh,GABA or glycine (eC, ). Dissociation of [3H]granise-tron following the addition of excess unlabeled ligand gave a ratethat was comparable to the values measured for G-FL using FC andFP (These results show that affinities measured using FCand FP are similar to those determined with radioligand binding.
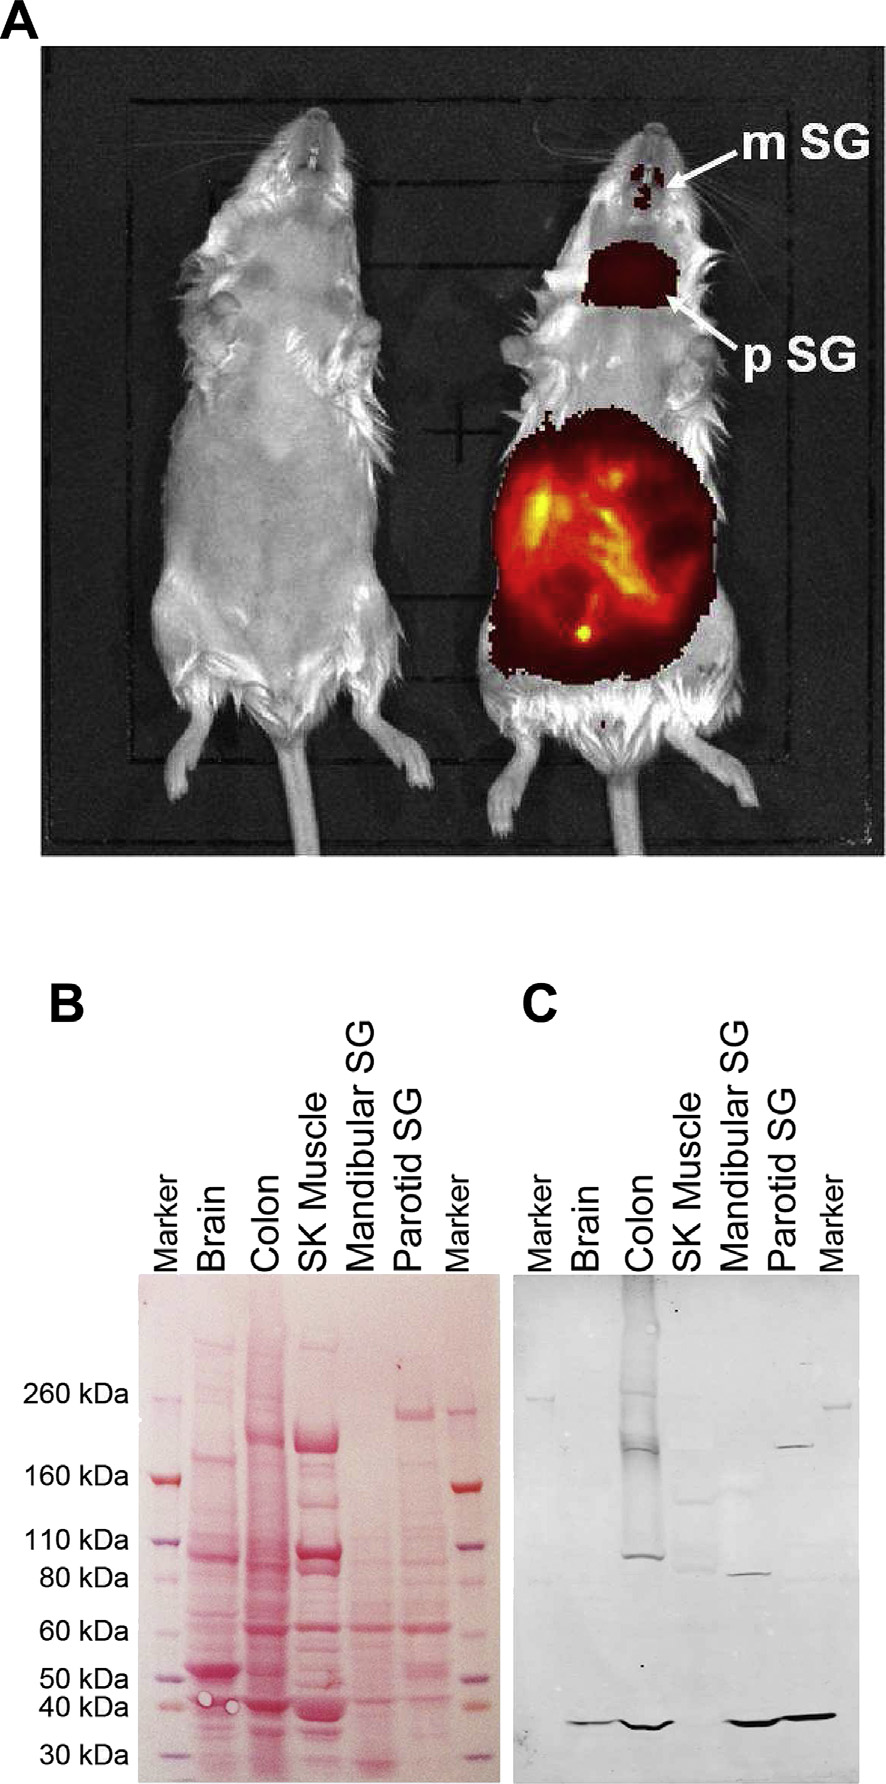
3.7. In vivo localization of 5-HT3 receptors
To further probe the utility of the new fluorescent probes we
used in vivo imaging of anaesthetized mice injected with G-SiR, acompound with near-infrared emission. After 5 min (5 mg/kg i.p.),staining was visible in the gut, and by 20 min post-injection wasalso visible in salivary glands Since the presence of 5-HT3receptors was not expected in salivary glands, further studies usingdissected mouse salivary glands from sacrificed mice wereperformed.
To confirm the presence of 5-HT3 receptors in these tissues
Western blot analysis was undertaken using a 5-HT3-specificantibody on total protein extracts from each of the identified organsA clear band was seen in each, corresponding to themolecular weight expected for the 5-HT3 receptor in Tris-Acetategels. No band was seen in skeletal muscle which was used as anegative control. These results show that G-SiR is suitable for in vivoimaging where it specifically labels 5-HT3 receptors.
Fig. 3. A possible orientation of G-FL in the 5-HT3 receptor orthosteric binding site. (A)G-FL (orange) is oriented using a pairwise alignment with the heteroaromatic rings of
granisetron (purple) bound to the 5HTBP (gray surface) co-crystal structure (PDB:2YME). In this orientation the fluorophore can be accommodated within the bindingsite. The pairwise alignment was made using PyMol v1.3 (Schr€
odinger LLC, OR, USA).
We report the synthesis of high affinity fluorescent 5-HT3 re-
(B) The effects of mutations on granisetron binding are the same as those reported
ceptor antagonists to create a series of ligands that cover a broad
elsewhere and similar to effects on G-FL.
fluorescent spectrum from blue to near-infrared emission. Wedescribe the application of G-FL in FC and FP, showing that it ispossible to determine accurate and reproducible ligand bindingaffinities and kinetic parameters. As predicted from its spectro-
was not reduced by either the Cys-loop receptor agonists ACh,
scopic properties, G-SiR gave clear staining in vivo, that was
GABA and glycine, or the non-competitive antagonist picrotoxin
consistent with the known tissue distribution of 5-HT3 receptors.
(PTX) at concentrations of up to 100 mM. These data show that 5-
These results are consistent with the specific, displaceable binding
HT3 receptor ligands specifically compete with G-FL at the
that we observed in radioligand binding assays and with previously
orthosteric binding site, which can be used as a fluorescent probe
reported specific binding of other fluorescent granisetron-
for determining the affinities of non-labeled competitive ligands.
derivatives using confocal microscopy Assuch, our study demonstrates the utility of novel fluorescent 5-HT3
3.5. Flow cytometry
receptor ligands across a range of highly applicable pharmacolog-ical approaches.
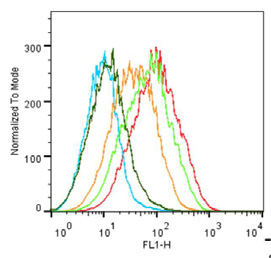
G-FL was also evaluated as a novel probe for FC. The results show
Nanomolar affinities for our fluorescently labeled granisetron
that G-FL caused a specific dextral shift in the geometric mean
derivatives at the 5-HT3 receptor were shown Coupling of
when compared to similar experiments in the presence of excess
fluorescein to the N1 position caused no apparent change in affinity
unlabeled ligand or with untransfected HEK 293T cells (A).
when compared to the parent ligand granisetron. This is consistent
With G-FL a saturable increase in the geometric mean yielded a pKd
with previous reported structureeactivity relationships
of 8.49 ± 0.12 (Kd ¼ 3.23 nM, n ¼ 6), similar to that determined in FP
). The effects of mutations on granisetron binding were
and RB. Also similar to FP, competition with known ligands and
also consistent with previous studies that reported substitutions at
negative controls showed that the interaction was specific B
R92, W90, T179, Y141 and W183 strongly affected binding, while
and C, and the rate of dissociation of G-FL in the presence
mutations at L126, N128 and Q151 had only minimal effects
of excess non-labeled ligand was comparable D). These re-
sults show that G-FL is also suitable for studying ligand binding
magnitude by which the affinities of granisetron and G-FL changed
following substitution differed ( 3-fold for L126C, 13-fold forN128C and 19-fold for Q151C) and shows there are some differ-
3.6. Radioligand measurements
ences in their binding, but the pattern of changes was similar forboth ligands suggesting that they occupy broadly similar positions
To determine whether affinities measured using FC and FP were
within the binding site. An alignment of the granisetron moiety of
similar to those measured using a more established method we
G-FL with granisetron bound to 5-HTBP () supports this
T. Jack et al. / Neuropharmacology 90 (2015) 63e73
Fig. 4. Characterization of G-FL. (A) Saturation binding of G-FL using FP; Inset, visualization of FLAG-purified 5-HT3 receptor with colloidal Coomassie staining (left) and Westernblot analysis (right) using goat anti-FLAG/donkey anti-goat IRDye 800CW (green) and mouse anti-myc/donkey anti-mouse IRDye 680CW (red). The overlay of these two colors isyellow and a band at 55 kDa in the right lane corresponds to a 5-HT3A subunit monomer which displays both FLAG and myc epitopes. Weaker bands above 110 kDa are also seenfollowing purification. (B) Association of G-FL at different concentrations of the 5-HT3 receptor was measured using FP. Data points were fitted with a mono-exponential function toyield kobs. (C) Linear regression was used to fit kobs against the G-FL concentration to give kon (slope) and koff (y intercept at x ¼ 0). (D) Dissociation of G-FL was measured followingthe addition of excess unlabeled ligand at t ¼ 0 to G-FL equilibrated 5-HT3 receptors. (E) Competition of varied concentrations of known 5-HT3 receptor antagonists with 2 nM G-FL.
(F) Competition with varied concentration of 5-HT3 receptor agonists. Panels D, E and F traces are single experiments, but are representative of the larger dataset summarized in thetext and . In panel B the symbols refer to values for no G-FL (-) or 0.2 nM (▫), 0.5 nM (▵), 1 nM (:), 2 nM (o), 3 nM (7), 4 nM (◊), 5 nM (✕), 6 nM (A) and 8 nM (;) G-FL.
hypothesis, as the conjugated fluorophore is not sterically
restricted in this orientation Also, the rela-
). As the dissociation rates measured by of FC and RB were
tively high fluorescence polarization for the receptor-bound G-FL
similar, we can conclude that association rates were also compa-
ligand suggests that fluorescein has a low degree of rotational
rable, given the similar affinities and the simple relationship be-
movement, as expected in the tightly enclosed environment of the
tween koff, kon and Kd (Eq. FC and FP competition on purified 5-
5-HT3 receptor ligand binding site.
HT3 receptors also provided affinities for several unlabeled 5-HT3
G-FL had the highest affinity that was consistently shown with
receptor agonists and competitive antagonists that had the same
all three techniques described here (FC, 3.23 nM; FP, 1.14 nM; RB,
values and rank order as RB competition assays. This supports the
1.90 nM). Similar affinities have been reported for the parent gra-
utility of G-FL for pharmacological measurements that were facil-
nisetron molecule elsewhere ) and
itated by the large changes in fluorescence intensity and polariza-
association (kon ¼ 1.2 � 107 M�1 s�1) and dissociation
tion that provided an excellent signal to noise ratio. As all of the
(koff 0.004 s�1) rates of G-FL were also comparable to those re-
methods accurately reported binding properties there appears to
ported for granisetron at similar temperatures
be no adverse influence from using receptors that are detergent-
solubilized (FP), within crude cell homogenates (RB) or expressed
kobs and koff were best fitted with single components, which is
on the surface of live cells (FC).
consistent with the single population of binding sites (AþA�) that
Here, we utilized the stable expression of FLAG/myc double-
is present in homomeric 5-HT3 receptors
tagged 5-HT3 receptors in HEK 293T cells using a lentiviral
T. Jack et al. / Neuropharmacology 90 (2015) 63e73
Fig. 5. 5-HT3 receptor pharmacology measured with flow cytometry. (A) Saturation binding of G-FL determined using the shift in geometric mean. Inset fluorescence intensitydistributions used to plot the binding curve (labels show the G-FL concentrations). (B) Competition binding of varied concentrations of known 5-HT3 receptor antagonists with10 nM G-FL. (C). Competition with known 5-HT3 receptor agonists. (D) Dissociation of G-FL was measured following the addition of excess unlabeled ligand at t ¼ 0 to G-FLequilibrated cells. Panels B, C and D are single experiments, but are representative of the larger dataset summarized in the text and .
system. Affinity purification over the N-terminal FLAG tag yielded
and purification of a fusion protein of 5-HT3 receptor with a
up to 90 mg mL�1 of purified protein from 1200 cm2 of cells
bacteriophage envelope protein and a C-terminal tag (
(3 � 105 cells/cm2) grown in monolayers. This is 83 pmol of pu-
Our experiments using an anti-c-myc affinity gel were un-
rified receptors and the equivalent of 106 binding sites/cell, which
successful because of the high abundance of endogenous c-myc
compares well with other studies (
protein in 293T cells. These different results highlight the diversity
). These receptors had intact binding sites with a phar-
of possible tags and the need to determine the appropriate one in
macology matching that of 5-HT3 receptors described elsewhere
each experimental system.
We have shown here that two different fluorescent methods (FC
trometry analysis gave a fragment pattern with 80% coverage of the
and FP) provide consistent measurements of binding affinity and
5-HT3 receptor making its identification unequivocal. Purification
kinetics that are comparable to values from more traditional
of the mouse 5-HT3 receptor was recently reported and also gave
methods such as radioligand binding. Previously we have demon-
good yields using an N-terminal strep-tag, and poor yields with a C-
strated the utility of these 5-HT3 receptor ligands for visualizing the
terminal His10 (). Based on the gel images in
specific labeling of cell-surface receptors using confocal microscopy
the purity of their receptor was comparable to
Using a different fluorescent approach to
ours following a single step purification and similarly displayed a
study 5-HT3 receptor pharmacology, have
higher molecular weight impurity that was identified as binding
also described the use of a voltage-sensitive fluorescent dye. In
immunoglobulin protein (BIP). Elsewhere, higher molecular weight
these studies the voltage-sensitive dye reported functional re-
bands have been suggested to be glycosylated and calnexin-
sponses and was consequently able to probe the actions of both
associated 5-HT3 receptors ().
competitive and non-competitive ligands. In contrast, the FC and FP
In our preparation, the two higher molecular weight bands were
assays reported here are more limited as they focus on a single
both labeled by anti-FLAG and anti-myc antibodies, suggesting that
binding site (similar to RB). However, they can easily be adapted to
they both contain 5-HT3 receptor proteins (a
high-throughput methods and, as such, provide an ideal accom-
hypothesis that was supported by the identification of 5-HT3 re-
paniment to voltage-sensitive dyes in high-throughput screening
ceptors using mass spectrometry of these bands. In contrast to the
programs. Of the two fluorescent methods described here, FC was
findings of and ourselves, the successful
the simplest as it required only standard cell-culture materials,
purification of the C-terminal His6-tagged purified mouse 5-HT3
could be performed on live cells, and provided time- and cost-
receptor was reported by and
efficient measurements that were reliable, reproducible and could
where it was immobilized on a quartz glass surface and used with
be readily adapted to multi-well formats. Another fluorescent
fluorescein labeled GR119566X in real-time ligand binding assays.
probe within our series (G-SiR) emitted in the near-IR region of the
The use of His6 was also reported following bacterial expression
spectrum and was ideal for in vivo studies since the longer
T. Jack et al. / Neuropharmacology 90 (2015) 63e73
Fig. 6. Radioligand saturation and competition binding. (A) Competition between 0.75 nM [3H]granisetron and varied concentration of 5-HT3 receptor antagonists; Inset, saturationbinding of the radiolabeled probe [3H]granisetron. (B) Competition binding of [3H]granisetron with known 5-HT3 receptor agonists. (C) There was no competition with ligands thatare agonists of other Cys-loop receptors or the non-competitive antagonist picrotoxin (PTX). (D) Dissociation of the granisetron following the addition of excess unlabeled ligand.
The dissociation rate of [3H]granisetron was similar to rates measured for G-FL in FC and FP assays, consistent with the similar affinities of the two ligands. (E) A comparison ofbinding affinities determined using FP and RB. (F) A comparison of binding affinities measured with FC and RB; (a) mCPBG; (b) 5-HT; (c) quipazine; (d) tropisetron; (e) G-FL; (f)granisetron; (g) palonosetron. The dashed line is unity. The values are from Panels A, B, C and D are single experiments, but are representative of the larger datasetsummarized in the text and
wavelengths have reduced phototoxicity, give deeper tissue pene-
Thiazole orange (TO) is known to
tration and are further from the auto-fluorescence that is often seen
self-quench owing to stacking, but emits light when the stacking is
in biological tissues In our studies the
disrupted by binding (
presence of 5-HT3 receptors in mammalian brain and gut was ex-
), a property that gives low background fluorescence
pected as it is known to be widely distributed in these regions
and we found preliminary evidence of when using our ligand G-TO
), but its presence in salivary
(unpublished data).
gland is not as well reported (Also, while se-rotonin is known to be present in salivary glands, there is evidence
for the role of metabotropic 5-HT receptors, rather than the iono-tropic 5-HT3 receptor (). The physiological func-
We report nanomolar affinity fluorescent 5-HT3 receptor ligands
tion of these receptors is therefore currently unknown and requires
with absorption and emission that cover a wide range of the fluo-
further work. Other fruitful avenues of research may also use
rescent spectrum. We show they occupy the 5-HT3 receptor
acridone and 5-TAMRA conjugated ligands as these are highly
orthosteric binding site and the highest affinity fluorescein-
photostable and have been used for confocal and high resolution
containing ligand can be utilized in FC and FP to probe this re-
techniques such as two photon excitation
gion. The fluorescent changes of all of our ligands offer excellent
T. Jack et al. / Neuropharmacology 90 (2015) 63e73
National Science Foundation [CRSII3-136222], the NOMIS Founda-tion and the HOLCIM Stiftung zur F€
orderung der wissen-
Appendix A. Supplementary data
Supplementary data related to this article can be found at
Fig. 7. Characterization of 5-HT3 receptors in mouse tissues. (A) In vivo imaging of G-
SiR (5 mg/kg, i.p.) after injection into anaesthetized C57BL male mice. Representative
image of control (left) and injected (right) mice after 20 min. Strong fluorescence is
visible in the abdominal cavity showing intestine, but also in salivary glands (as evi-
denced by subsequent dissection). Mandibular (m) and parotid (p) salivary glands (SG),
respectively, are indicated by arrows. (B) Ponceau staining of total protein extracts
(37.5 mg) from mouse tissues. (C) Visualization of 5-HT3A receptor subunits with goat
anti-5-HT3 followed by Donkey anti-Goat IRDye800CW. A clear band was visible at the
size expected for the 5-HT3A subunit. The gel shown is a representative example of
three other similar gels. SK ¼ skeletal (muscle); SG ¼ salivary gland.
signal to noise ratios, and the measured affinities and binding ki-
netics are reproducible and reliable, making them ideally suited for
pharmacological studies or as an alternative to antibodies that are
not able to penetrate tissues in vivo.
We thank Prof. John Peters for providing the 5-HT
subunit cDNA and Prof. Oliver Mühlemann for kindly providing lab
space for MDR. We thank Prof. Roch-Philippe Charles for assistance
with mouse experiments. This work was supported by the Swiss
National Science Foundation [SNSF-professorship PP00P2_146321/
1 to ML]. MDR was supported by a Sinergia grant from the Swiss
T. Jack et al. / Neuropharmacology 90 (2015) 63e73
Source: http://muehlemann.dcb.unibe.ch/publications/Jack_Neuropharmacology2014.pdf
APPLICATION MANUAL 2016 09 GENER AL INFORMATION 86 Machines, Tools, and Aids 14 General Product Information 21 Swarovski Products and Suitable Application 100 Quick Assistance101 Swarovski Hotfix Selector 23 SOLDERING, PL ATING, AND STONE SET TING SEWING, EMBROIDERY, AND HAND APPLICATION 24 Machines, Tools, and Aids25 Suppliers 112 Product Overview 112 Machines, Tools, and Aids
Peninsula Health - Community Dental Program Dental Management of Presentation based upon DHSV Clinical Practice Guidelines Presented by Dr Fayed Azouz Clinical Head Peninsula Health – Community Dental Program 1) To inform the Peninsula Health Community Dental clinical staff on the Current DHSV Clinical Practice Guidelines for dental care management of the pregnant woman.